Using the Chrome Debugger Tools, part 9 - The Console Tab
This will be the concluding post on my multi-part tutorial series covering the Chrome debugger
tools.
With this final post, I'll cover the right-most tab, the console tab.
You can reach the console tab by clicking on it, of course, but
the console tab is also available as a pop-out drawer in any other tab if you click the
Show Drawer icon on the upper-right. Alternatively, the Show Drawer function — you can use it to pop the console in and
out. When the console is visible — either by popping out the drawer or by navigating to the
Console tab, anything you type on the console will be executed as Javascript in the
current context. Figure 1, below, illustrates the console tab and the show drawer
function (redundant when the console tab is already open).

Figure 1: The console tab
Anything you type into the console at the prompt will be evaluated as a Javascript expression and the results
of the expression will be echoed beneath the command prompt. If an error occurs, the stack trace
of the error will be output instead. If the expression doesn't return a value, the console will
report undefined — this doesn't mean anything is wrong, it's just letting you
know that the previous expression didn't return a result. Figure 2 shows the output of a couple
of Javascript expressions on the console.

Figure 2: Some simple console outputs
This can be a great learning tool when you're starting to get your feet wet with Javascript, but
it's worth noting that you also have complete access to the entirety of Chrome's V8 Javascript
engine as well as the DOM representation of the page that you're viewing and its variables. This
means that, at any time, you can view or change the value of any variable accessible to the
page. To keep track of what you have access to, though, you must bear in mind that
in Javascript, all variables are tied to a particular scope. If declared with the keyword
var within a function, the variable is scoped within that function; otherwise, they
belong to what is referred to as the global scope. Consider Example 1 that
declares a few Javascript variables and includes an iframe that has its own javascript variables.
The head includes the following declaration:
And the body itself declares:
<script>
  var x =5;      // This variable is bound to the global scope, the top-level window

function f()    {
        var y = 6;      // This variable is bound to the f() function, and not visible.
}
</script>
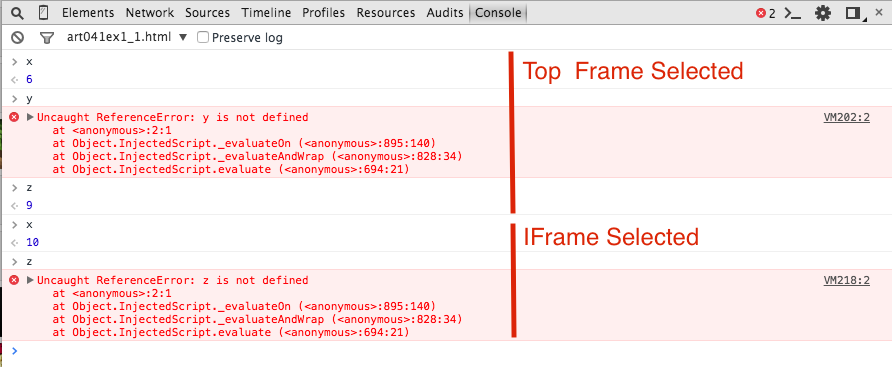
Figure 3 illustrates that you can query the values of
var z = 9;
x and z from the
console, but not y since it's scoped to function f — that is, it
only "exists" while function f is running.

Figure 3: Global variables
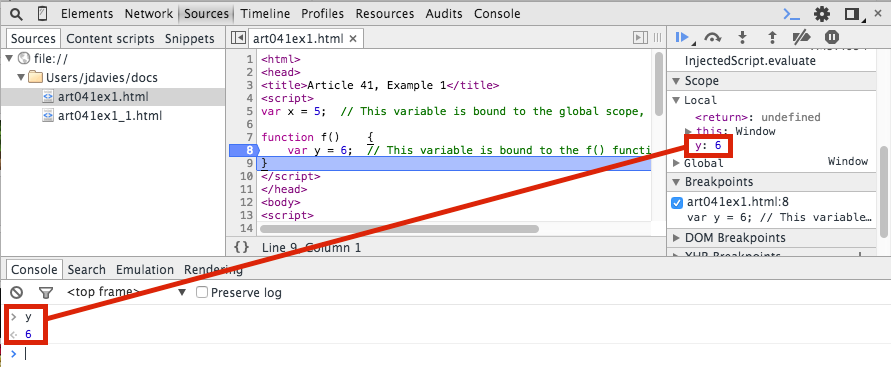
If you want to see the value of y, you have to run function f —
if you set a breakpoint in it, you can open the console as a pop-out from the debugger and view
the contents of y as shown below in figure 4. Of course, this is redundant in this
case, since the debugger view shows you the values of every local variable, but you can also
evaluate more complex instructions based on the value of the variables. I almost always have the
console open when I'm running the Javascript debugger for this exact reason.

Figure 4: Local variables
You may be wondering, if you've browsed the source code of example 1, how I triggered function
f in the first place — there are no references to it anywhere in the page
source. In fact, I ran it from the console itself! In addition to evaluating expressions, you
can also invoke functions on a page, including simulating button presses.
If you look over the source code of Example 1, you'll notice that it includes an iframe whose
source code, also declares its own global x:
But when I looked at the value of
var x = 10;
x in figure 3, it showed me the value from the
containing page. How can I get to the iframe? As this example illustrates, the
term "global" in browser Javascript is slightly misleading. The global scope is
actually an alias to the Window object, which there can actually be many of —
one for each frame in the page!
If you're viewing a page that has
multiple frames, the console will include a drop-down to select the frame whose global scope
you're interested in, illustrated in figure 5. Here, Top Frame refers to the
containing page — the one loaded by the address bar, and all iframes are listed by
their src name.

Figure 5: frame selection
Now, if you select this iframe, you'll see the value of the frame's variables, as shown in figure 6.

Figure 6: Switching global contexts
You can jump around from one context to another within the console just as you can within
Javascript itself using window.parent and window.frames, but the console
will obey all of the cross-origin scripting security rules that your Javascript must also obey,
relative to the selected top frame. In other words: when example 1 is open, you can set the
global context to top frame and invoke frames[0].x (remember that
window is the global object in browser Javascript, so everything you type
is implicitly related to window.), because example 1 and its iframe are both
served from the same origin. Similarly, you can set the global context to art041ex1_1.html
and see parent.x as illustrated in figure 7. However, if the iframe was served by a different domain
without cross-origin sharing set up, you would be denied with a security error.

Figure 7: jumping from one context to another within Javascript
You've seen how to work with your Javascript from the console — Chrome allows you to
operate in the other direction as well.
The non-standard (but very widely supported) Javascript console object allows you to manipulate
the console from your code. The most common use of this object is console.log
that allows you to output messages to the console at log level, but there are
actually five levels: Error, Warnings, Info, Logs and Debug. Before the widespread introduction
of console, we had to use window.alert as a debugging aid... and let
me tell you, if you haven't had to deal with that, you don't know how lucky you were.
Example 2 dumps some information on the console, as illustrated in figure 7.

Figure 8: The console output of various logger levels
Errors, warnings and info each have a particular icon associated with them, and each time console.error
or console.warn are invoked, the number will accumulate in the upper-right corner of the debugger tools next to the drawer icon.
On the left side at the top, the filter icon allows you to limit what is actually shown here. At the highest level of
abstraction, you can request that only certain log levels be shown. These don't "roll up" —
if you ask to see Info messages, you won't see warnings and errors as well (as
you might expect if you're familiar with other logging framework such as, say, log4j).
However, you can always control+click to select multiple simultaneous log levels. Alternatively,
you can filter out selectively by typing in a string to search for. Figure 8 illustrates filtering
out all except the errors and warnings using example 2.

Figure 9: filtered messages
The filter will only filter out console output from the message functions; it won't hide what you've typed interactively. If you are filtering out messages, you'll be notified in two ways: first, the top of the console will read, "x messages are hidden by filters." (although you may need to scroll up to see it). Second, if you've clicked the filter icon to hide the filter selection taskbar, the filter icon will appear red to remind you that you have at least one active message filter.That's it for my nine-part series on the Chrome debugger tools. Believe it or not, as long as this series has been, it's still not exhaustive! Chrome's debugger tools also include device emulation, so you can see how your page might render on mobile devices, rendering tips, color- coding, integration with IDE's, and keyboard shortcuts. In addition, the Chrome developers at Google are constantly working to improve Chrome, so we can expect to see even more advances in the near future. Happy developing!
Add a comment:
Completely off-topic or spam comments will be removed at the discretion of the moderator.
You may preserve formatting (e.g. a code sample) by indenting with four spaces preceding the formatted line(s)


Cheers
Patrick
Thanks,
Timo