Using the Chrome web developer tools, part 6: The Memory Profiler
Last time, I talked about the CPU profiler built into Chrome that lets you instrument your Javascript code and determine where slowdowns and bottlenecks occur. The CPU Profiler, though, is only one-third of Chrome's Profiles tab; the other two thirds are dedicated to memory profiling. Whereas the Timeline tab can be used to get a sense that your web application is leaking memory or not using it as efficiently as possible, the Timeline tab alone won't offer you much help in tracking down the source of the leak other than to give you a sense for what actions make it worse. Once you've identified a leak, it's time to turn to the memory profiling capabilities of the Profiler tab to do the heavy lifting.
Since Chrome's memory profiler gives you a lot of information, I'll start by going over the memory profile of a completely empty page. Further, I'll open it in Incognito mode, which limits the amount of infrastructure that Chrome brings in — even so, there's a lot of memory profiler information to sift through. Example 1 is nothing but an HTML tag — Chrome will insert a head and body tag to make it valid, but otherwise this is as close to "nothing" as you can get Chrome to load.
<html />
Example 1: Completely empty web "page"
The first step in obtaining a memory profile, after opening example 1 in a separate tab, is to open up the debugger tools, navigate to the Profiles tab, and click the "Take Snapshot" button of the profiling type panel as show in figure 1.
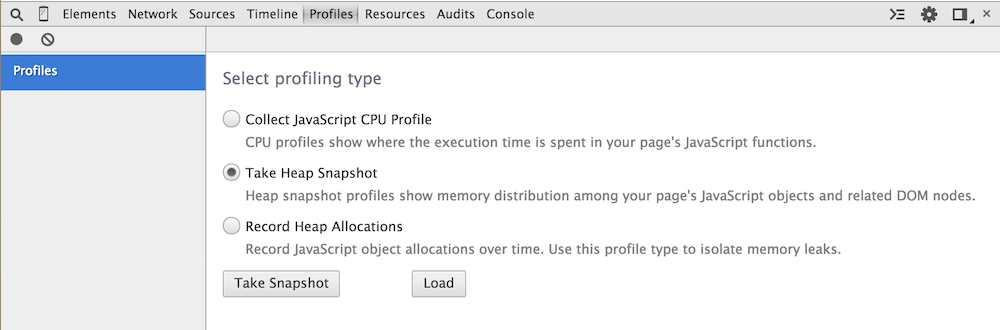
Figure 1: The Heap Snapshot welcome page
Once you do, you'll be presented with the summary view of the heap snapshot as shown in figure 2.
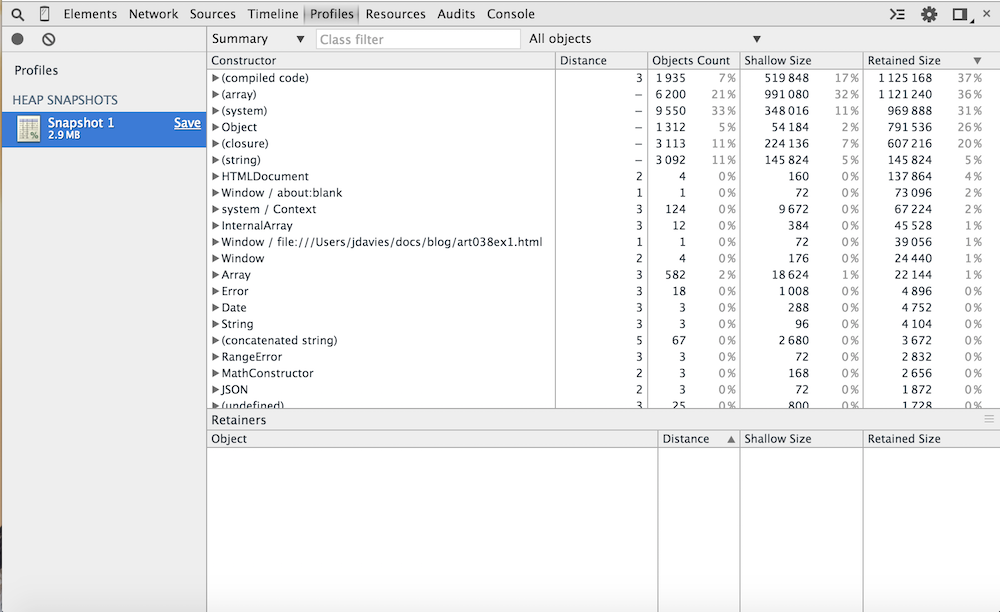
Figure 2: Bare-bones heap snapshot summary
Surprisingly, there are a lot of objects involved in rendering this simple — so
simple as to be practically nonexistent! — "page". Each Javascript object that has been
instantiated since this page loaded is grouped underneath its constructor class. Parenthesized
groupings indicate native constructors that you can't invoke directly; you can see in figure 2
that there are a lot of (compiled code) and (system) instances, but also some more "traditional"
Javascript objects like Dates, Strings and RangeErrors.
To make sense of all of this, start with a more complex, but still simple page that allocates some memory when the
user presses a button. Example 2 instantiates one object every time you click the "allocate"
button. Open it up and click the button a few times and then take a heap snapshot like you did
in figure 2. If you navigate down a bit, you'll see where the X'es that you allocated
are displayed in the heap snapshot as shown in figure 3.
<html>
<head>
<script>
var counter = 0;
var instances = [];

function X() {this.i = counter++;}

function allocate()	{
	instances.push(new X());
}
</script>
</head>
<body>
<button onclick="allocate()">Allocate</button>
</body>
</html>
Example 2: Allocate javascript objects
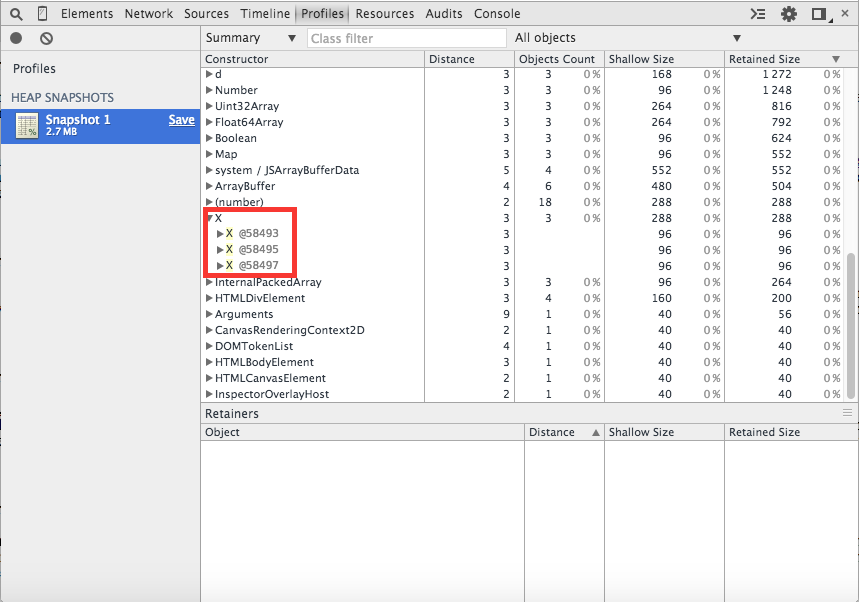
Figure 3: Heap snapshot view of the X objects
Still, you have to scroll around a bit just to find them; it would be nice to be able to declutter
the display a bit and see only your objects. Chrome's heap snapshot tool has a nice
feature that you'll use quite a bit that allows you to compare two snapshot views with one another,
focusing only on the differences. To use it, refresh the page and clear the heap snapshot view
with the clear all profiles button shown in figure 4.
Note that you must select clear all profiles to reset the heap snapshot view;
it will not reset itself if you simply refresh the page using, for example, F5.
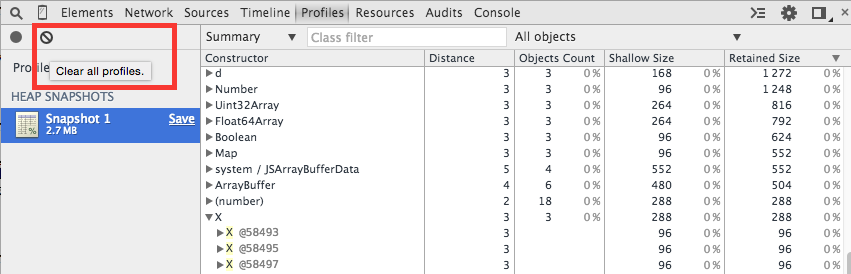
Figure 4: Clear all profiles
Now, before clicking on the Allocate button, take a heap snapshot. You can do this
by navigating to the welcome page as shown in figure 1, or by just pressing the Take heap
snapshot button next to the clear all profiles button. With the snapshot in hand, NOW
press the allocate button a few times and take another snapshot. The second snapshot
appears below the first and looks similar to figure 3. However, if you select the "Objects
allocated between Snapshot 1 and Snapshot 2" drop down shown in figure 5, the display will
collapse to focus on just the activity that took place after snapshot 1 — which is what
you're most interested in.
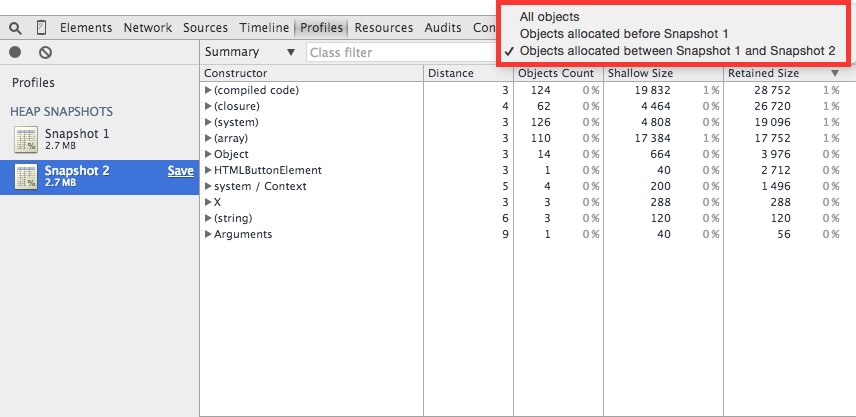
Figure 5: Objects allocated between snapshot 1 and snapshot 2
You might expect to see just the X objects, but as you can see in figure 5, there
was quite a bit of extra activity. Chrome tries to be intelligent about lazy-loading objects,
so for example you can see that the HTML button element that triggered the allocations wasn't
given any memory until the button itself was clicked. If you click it a few more times
and take a third snapshot to compare what happened after lazy-loading took place, you'll see an
even more abbreviated memory view as shown in figure 6.
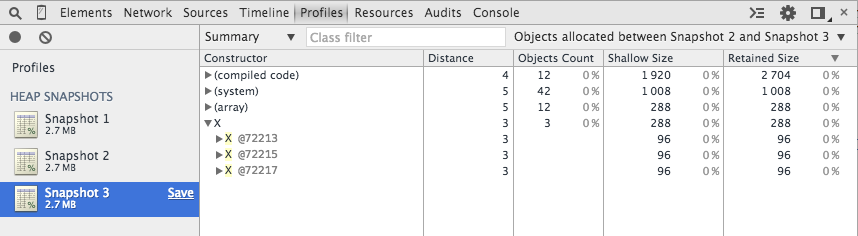
Figure 6: Object allocated strictly in support of creation of Xes
Even so, you can see that there was a lot more involved in allocating memory for these X
objects than just giving them their own memory. I'll come back to that in a bit, but for now
let's focus on the X objects themselves.
If you expand the disclosure triangle next to X you'll see the three X
instances that you allocated in between memory snapshots. Each one is reported as something like
X @100337 — the number after the @ is unique for each allocated object in your
page. If you refresh and reload the page, you'll get a new, distinct set of object IDs.
These IDs are just to help you keep object instances straight and don't refer to anything internal; in particular, they don't refer to actual memory addresses.
Each instance is listed under its class name (X in this case, but with a yellow
highlight that indicates that you can hover over it to see a debug dump of the contents of that
object, as shown in figure 7. This hover-over display is the same one that you would see if
you were to hover over an instance in the source debugger; it shows you all of the properties
of that object instance.
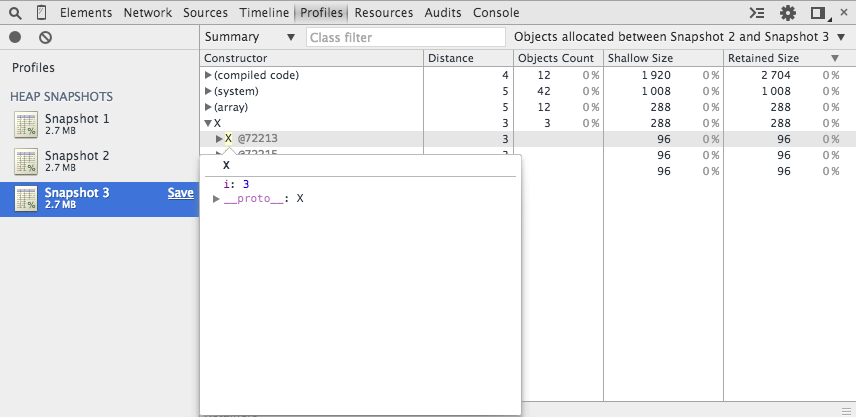
Figure 7: object instances
However, if you open the disclosure triangle next to the object instance, you can see a more memory-centric view of the object instance and even hover-over its constructor instance to see where it was instantiated as in figure 8; click through to open the constructor function in the sources tab.
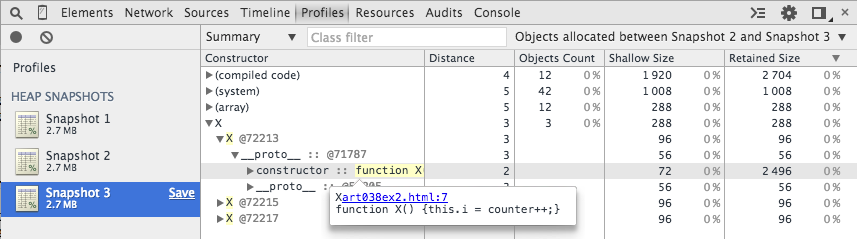
Figure 8: View and click-through the constructor function
Figure 8 is a tabular view with five columns. The first column is labelled Constructor,
indicating that the objects are grouped by their constructor function. As you can see in figure
8, not every object has a proper constructor; these are grouped by their logical constructor such
as compiled code or (system). The third column (don't worry, I'll come
back to the second) is the number of objects which have been instantiated by this constructor
in the time period selected. Recall that figure 8 is a view of "Objects allocated between
snapshot 2 and snapshot 3". Here, for instance, you can see that only 12 arrays were allocated
in that time period. If you scroll back up to figure 2, you can see that there were 6,200 arrays
allocated just to display an empty page. The fourth column is labelled Shallow size and displays the
size in bytes of the object that retains this one. As you can see, Javascript objects take up
quite a bit more space than their native language (e.g. C) counterparts — remember,
Javascript objects are associative arrays, and need to allocate space to keep track of their
hash buckets in case new properties are added to them.
The retained size column is probably more interesting from the perspective of the performance
tester. The retained size informs you of how many bytes are being held by this object due to
its own internal memory in addition to the objects that it is holding references to, hence
prohibiting garbage collection. Consider example 3, which is a modified version of example 2
except that each instance of X instantiates a Y that it holds a
reference to. Now, as illustrated in figure 9, each X has a shallow size of 104 bytes, but
a retained size of 200 bytes, since each one is preventing a Y from being garbage collected.
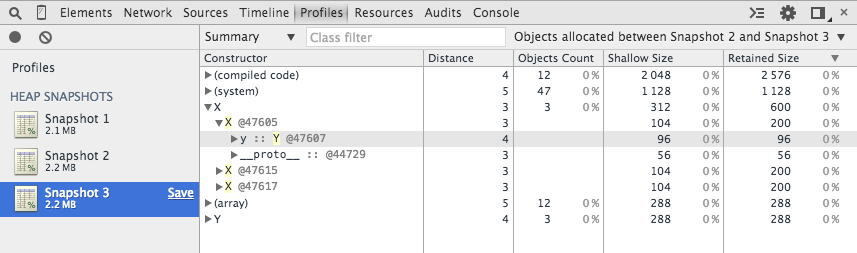
Figure 9: X retains Y
Note that Chrome's memory profiler is pretty smart when it comes to computing retained sizes of
objects. Consider example 4 which is a modification to example 2
where, instead of allocating a new Y, each X instead keeps a reference
to its predecessor in the instances array. You might expect the retained size of
each X to account for the reference that it holds to its predecessor in the array,
but as you can see in figure 10, this isn't the case. The reason is that it's not the X
that's actually preventing its predecessor from being garbage collected in this case, but instead
it's the instances array.
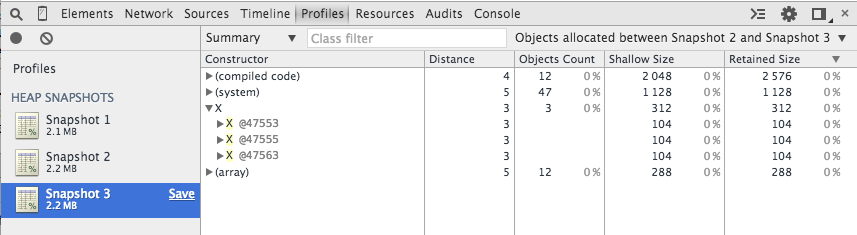
Figure 10: retained size equals shallow size since X isn't actually retaining anything
Earlier, I glossed over the Distance column. What are the "distances" and what do
they mean? Remember that memory leaks in Javascript occur when the garbage collector
can't garbage collect an object instance because another object is holding a reference to it.
That object in turn can't be garbage collected because another object is holding a reference
to it.
Click on an individual X instance to view the object in the lower pane as shown
in figure 11. Here you can start to get to the heart of garbage collection and memory optimization.
This object is on the heap because it is ineligible for garbage collection —
it is ineligible because it is referenced by another object which itself is ineligible for
garbage collection. The Object view in figure 9 allows you to follow the retainment
chain all the way up the Global object (which is never eligible for garbage
collection) and see why this instance is consuming memory. Here you can see that it's retained
because it's owned by the instances array which is itself owned by (attached to)
the Global object. A common cause of memory leakage in Javascript pages is such
an instance that should have been declared var but wasn't — and was therefore
attached to the page global memory — the objects view will allow you to quickly drill down
to reveal the culprit.
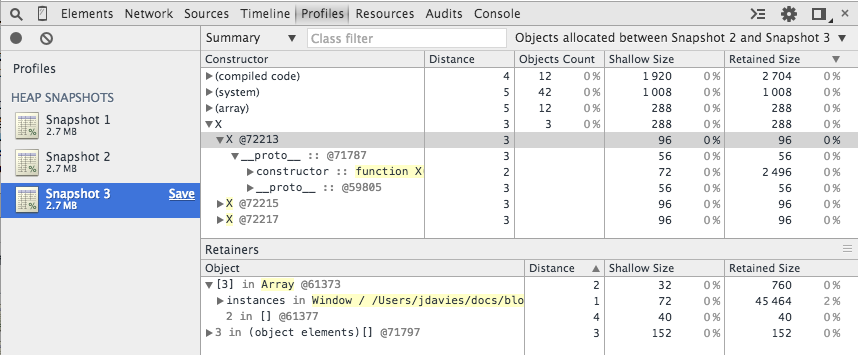
Figure 11: View object details in the Objects pane
There is a third option on the Profiles view: Record Heap Allocations. This view
is similar to the Take Heap Snapshot — it shows you shallow sizes, retained
sizes, object counts, etc., but it continuously runs until you stop it to give you a view similar
to the one that the timeline view gives you. As shown in figure 12, you can drill down into specific timeframes and see just the objects that were allocated in that
time period; for some uses, this might be more useful than comparing two snapshots against one
another.
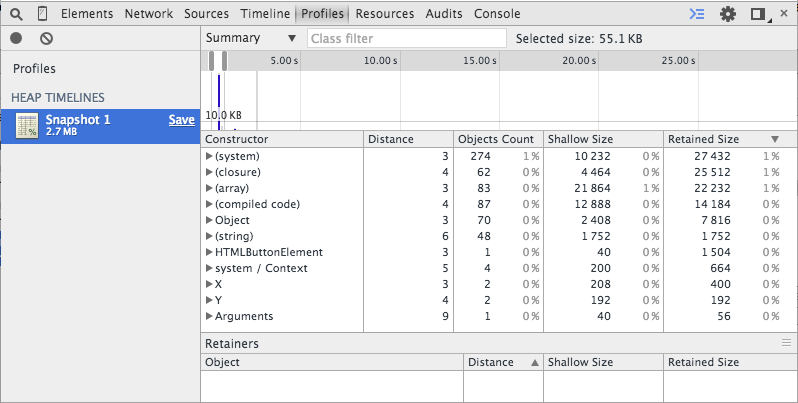
Figure 12: Heap timeline view
The memory profiler reveals some interesting details about the internals of Chrome. If you go
back to the All Objects view (or click on the first snapshot), and expand the
Window object, you can see the code that is responsible for window resizing as shown
in figure 13. A lot of the code is obscured as [native code] which generally means it's written in C;
however, a lot of Chrome was developed in Javascript as well and you can uncover some interesting
details about how it works just by clicking around a heap dump.
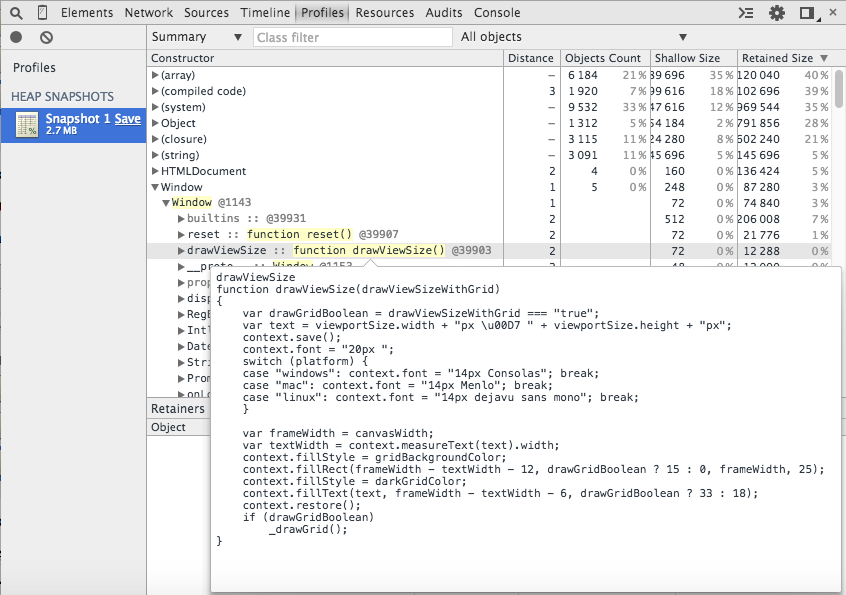
Figure 13: drawViewSize Chrome internal
I was able to pretty consistently crash Chrome, though, by trying to hover over the
Window field (figure 14), so beware how deep into the internals you try to go. If you're in the
middle of an important debugging session, stick to your own variables.
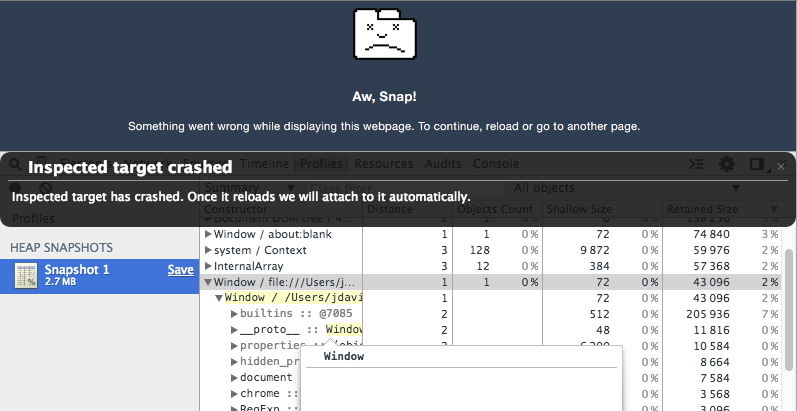
Figure 14: Crashing Chrome by trying to look at the empty window
Part 7: The Resources TabAdd a comment:
Completely off-topic or spam comments will be removed at the discretion of the moderator.
You may preserve formatting (e.g. a code sample) by indenting with four spaces preceding the formatted line(s)
I do want to point out though that in comparison to the detailed explanations you gave about the different columns, you didn't give a very straightforward explanation of the "Distance" column.