Using the Chrome web developer tools, part 5: The CPU Profiler
Since late last year, I've been covering one tab in the Chrome debugger tools each month. This installment continues by examining the CPU profiling capabilities built into Chrome. Typically, when we start to put together a Javascript-intensive page, we focus initially on how to make it work — only after all the desired functionality has been demonstrated to be operational do we start to wonder if it's working as fast as it could. Generally, this is the correct approach — Knuth famously said that "premature optimization is the root of all evil" — but it is the case that once everything is working, there are parts of the page(s) that can be sped up to create a noticeable benefit to the user.
Javascript inefficiencies (as opposed to HTML/CSS/DOM inefficiencies) typically come in two forms — long-running functions and memory leaks. Although running long is reasonable if a function needs to run for a long time to perform its purpose, it's generally the case that Javascript functions must return quickly for the page/application to appear responsive to the user. And even with Chrome's advanced V8 Javascript engine, Javascript itself is not known for its screaming speed when compared to natively compiled languages like the C language that Chrome itself is written in. The built-in CPU profiler is designed to help you determine which statements are being run the most often and how long functions are taking to complete — this helps you spot potential inefficiencies.
Example 1 is a very simple page that includes a basic Javascript
invocation. When you click the button, the global function a is invoked, which
calls b which in turn calls c which makes a console
call. If you open up the Chrome debugger tools, navigate to the Profiles tab and make sure
that "Collect JavaScript CPU Profile" is selected as illustrated in figure 1, below, you can
see the CPU profiler output of this very simple example.
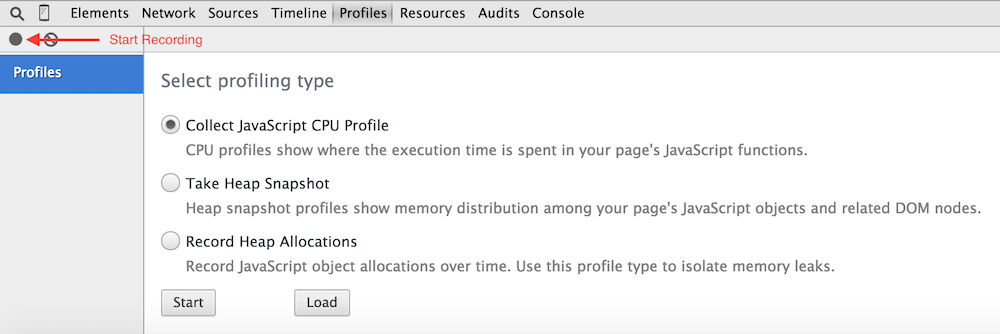
Figure 1: CPU Profiling
Click the Record button in the upper left corner of the profiler tab, move the mouse up and click the button labelled "click" on the page, and then stop the recording (by pressing the record button again). You'll see the CPU profile shown in figure 2.
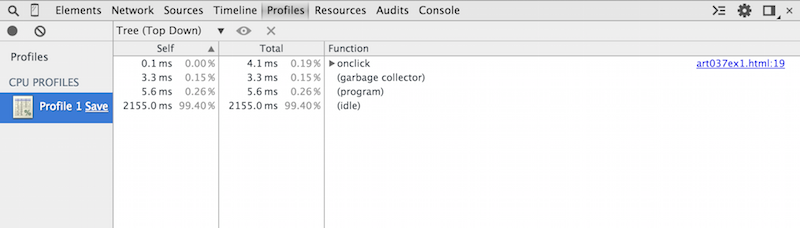
Figure 2: Simple CPU Profile example
Here you can see that the profiler captured a little over 2 second's worth of data (2164 ms,
to be precise), and that the V8 engine that is responsible for parsing and interpreting Javascript
was idle for most of that time — that accounts for the time it took me to move my mouse
up to the button, click it, and move it back down to the record button. The garbage collector
ran in this time period, but most of the action of interest is in the onclick
handler. You can expand it to get more information on what it comprised by expanding the disclosure
triangles in the display as shown in figure 3.
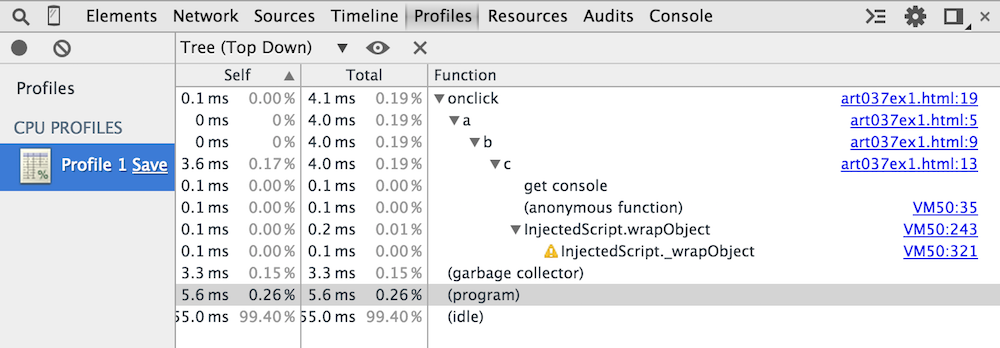
Figure 3: expanded onclick view
This shows pretty much what you'd expect — onclick calls a,
which calls b, which calls c and then console.log. One
interesting point about the view in example 3, though, is that you get a peek inside Chrome's
internals. In fact, you can click in to the invocations and look at the implementation of
console.log as shown in figure 4.
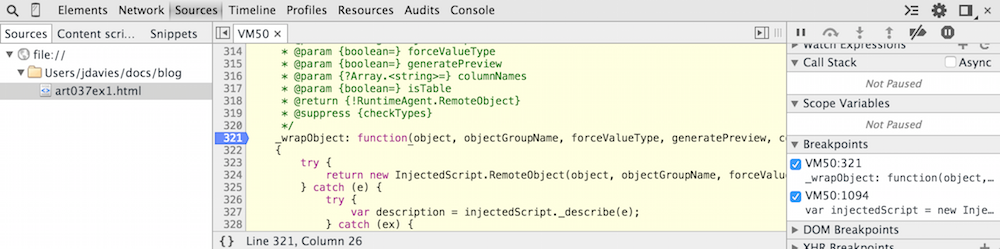
Figure 4: Chrome internals
Click back to the Profile tab to return to the CPU Profile view. The default CPU profile view shows you the "top down" tree, where each line is a "root" —
that is, a function call that wasn't called by another. You can invert this tree by selecting
"bottom up" as shown in figure 5; in this case, each line is a "leaf" and expanding the leaves
shows you the caller of each function (so each line is not necessarily unique in this view).
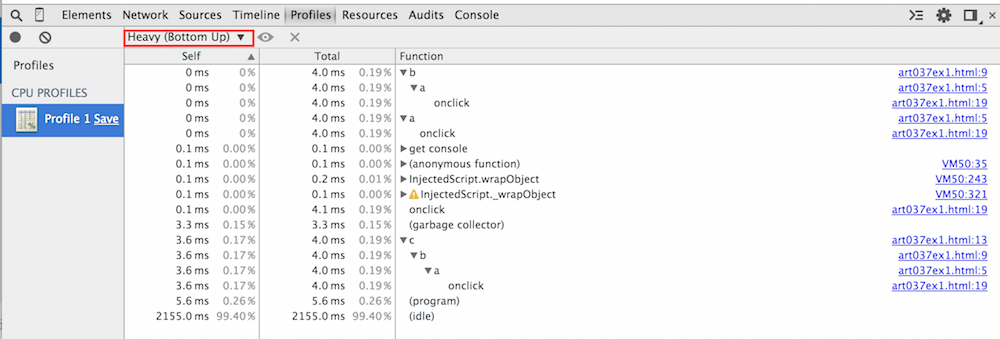
Figure 5: Bottom up view
This view really gives you a way to quickly determine who the real performance hogs are in your application — most of the time, the leaf nodes are the culprits, although it can also be the case that a higher-level function is calling a well-behaved function over and over again, causing a slowdown, so you should switch between the top-down and bottom-up views, sorting by time, to figure out where to focus your optimization efforts.
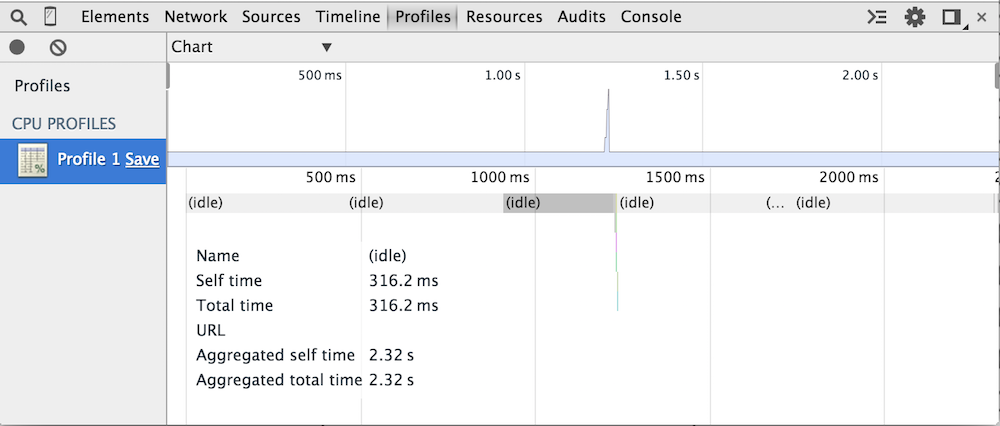
Most interesting is the "Chart" view, shown in figure 6.
Figre 7: chart view
At first, it doesn't look like there's much to see. The timeline along the top tells me that the CPU profiler recorded for 2 seconds — if you look closely, though, you'll see a very quick spike in activity around the 1 second mark. If you read my piece on the timeline tab, you should be familliar with this layout and know that you can click on an area of the timeline to zoom in on it as shown in figure 7.
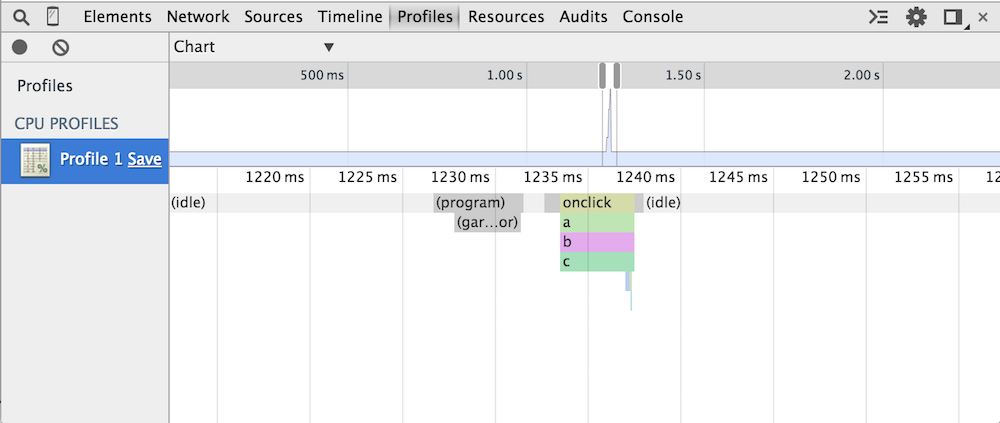
Figure 7: chart view zoomed in on the area of interest
Now you can see how that each call stack is illustrated in color — the colors themselves don't actually have any meaning; they just server to distinguish the calls from one another. If you hover over one of the colored function areas, you can see more details about the call as shown in figure 8.
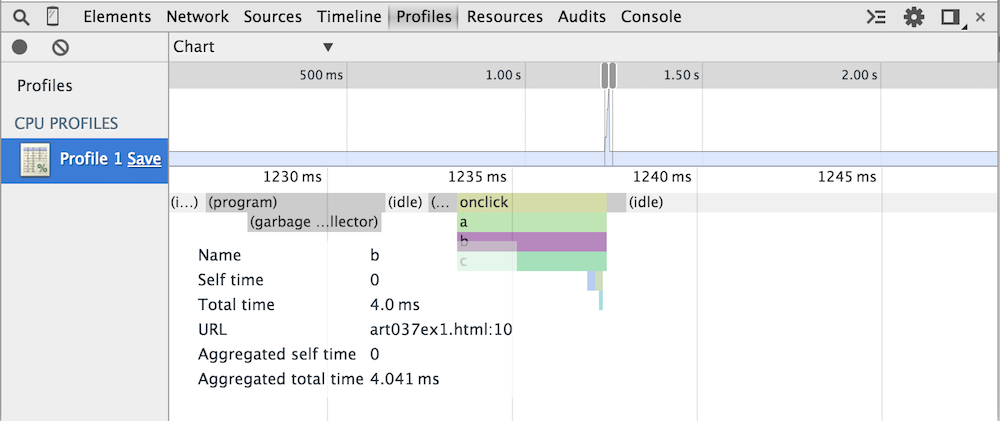
Figure 8: more detail about the b call
Add a comment:
Completely off-topic or spam comments will be removed at the discretion of the moderator.
You may preserve formatting (e.g. a code sample) by indenting with four spaces preceding the formatted line(s)
var d = new Date()
my Javascript program is going to allocate a few bytes to store this new Date object. If I call this again, I'll allocate a few more bytes... if I call this too many times, I could end up exhausting all available memory. In C, it was up to the programmer to remember to "free" all allocated memory - the problem being that many programmers either forgot entirely or at least weren't careful about freeing memory. Over time, this sort of "memory leak" would use up all available memory and cause the program to crash. More dynamic languages (including old ones like Lisp) include runtimes that keep track of how much memory is in use and free it automatically when it's no longer reachable.