Welcome back to my multi-part series on the Chrome Debugger tools.
Last time, I examined the first tab in the
Chrome debugger tools, the Elements tab. Working left-to-right,
the next tab is the Network tab, which I'll explore here. Whereas the Elements tab
is useful for debugging and troubleshooting code that's not rendering properly
once it has already been downloaded, the Network tab focuses on how
the data that is rendered gets loaded into the browser in the first place.
To make sense of the Network tab, you must have a good understanding
of the fundamentals of the HTTP
protocol. It's legitimate to think of the Network tab as showing you, graphically, how the
HTTP protocol went about retrieving the data that makes up the page you're
viewing. Fortunately, HTTP isn't hard to understand. It was originally
designed to be a simple protocol and, although the current specification has
grown to 176 pages, the basics are still pretty straightforward.
Since HTTP was designed to run on top of TCP, it's connection-based; that is,
the first thing an HTTP client (such as a browser) must do is establish a TCP
connection with an HTTP/"web" server. This connection is made, by default, on
port 80 with the IP address associated with the host part of the URL; the
IP address of www.commandlinefanatic.com, for instance, is 66.147.244.184.
Once this connection has been established, assuming the server accepts it,
the clients job is to describe what it wants to download. This download,
typically a web page, is described generically as a resource.
Resources are specified by their paths relative to the servers
root. When you type a URL into the address bar of your browser, for example, this is the path part;
everything after the third / character. Given a URL of
http://www.commandlinefanatic.com/index.html, the client will form a
valid HTTP request that should look something like, at a minimum:
GET /index.html HTTP/1.1
Host: www.commandlinefanatic.com
Connection: Close
Example 1: Sample HTTP request
Note that what I'm showing here is not some codified representation of what's
actually sent — the text is sent just as it's displayed here, in
ASCII format, line-breaks included. Assuming the server accepts the
GET request and it's not malformed, it will respond with, at a
minimum:
HTTP 200 OK
Example 2: Sample Minimal HTTP response
The second token in the response, the 200 above, is the response
code that indicates what the server could or couldn't do with the request. A
code of 200 indicates that the requested resource, such as
/index.html, was found and is being returned. However, the dreaded
404 means that the request was formatted correctly, but that the
resource doesn't exist, at least not on this server.
The Chrome debugger network tab lays bare many of the internal
details of how Chrome goes about fulfilling HTTP requests on your behalf.
Be careful before you try to view it, though — if you load a page, then open
the Chrome
debugger tools and click on the network tab, you'll see nothing at all;
the debugger tools must already be open when the page loads before you'll see
anything in there. If you forgot to open the debugger tools, you may have to
reload the page (which may or may not be a big deal depending on what the page does).
Figure 1 illustrates the network tab on a single-file page (Example 1 from part 1). As you can see, there's a lot of information to be had about this one file download.
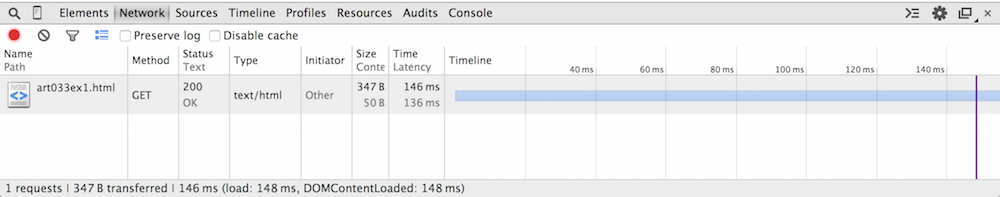
Figure 1: Network tab for a single-file page
In this example, there's one line in the network tab response, which summarizes exactly one HTTP request/response pair.
| Column Name | Purpose |
|---|---|
| Name |
The name of the resource that was retrieved. In this case, notice that the
name is just art033ex1.html; it does not include the full url
http://www.commandlinefanatic.com/art033ex1.html. This is what
was actually requested from the web site; the HTTP protocol dictates that the
URL part is passed in as an HTTP header, but what was actually requested was
the path. If the document had belonged to a sub-path, though, the sub-path
would be shown here, even if the originating link had been a relative one.
If you look back at example 1, the requested resource is the second token
that is passed to the server: /index.html in that example.
|
| Method |
HTTP supports 8 "methods": GET, POST, HEAD, OPTIONS, PUT, TRACE, DELETE and CONNECT. Of
these, only GET and POST are common. If you type
a URL into the address bar of your browser or click a link, a GET
request is initiated for the URL in the address bar or the href
attribute of a clicked link. On the other hand, if you fill out a web form and click the
submit button, the values of the input boxes in the web form will
be POSTed to the website. This is the key difference between
GET and POST; POST includes a body,
GET does not. Here, because the network trace was generated by
clicking a link, this is a GET request.
|
| Status/Text |
This column summarizes the HTTP response; recall from example 2 that a minimal
HTTP response includes the token HTTP followed by a number
indicating the disposition of the request followed by (arguably) human-readable
text describing the condition in greater detail; in this case, the particularly
terse OK.
|
| Type |
Example 2, the sample minimal HTTP response above was, indeed, a very bare-bones HTTP response; you were probably
wondering where the web page was! In fact, although Example 2 was a perfectly
legitimate HTTP response, in nearly all cases, an HTTP response consists of
a status line such as the one shown in example 2, followed by a series of
headers, and finally followed by the response body — in this case,
a fairly minimalistic HTML (web) page. One of the HTTP headers is the
type of the response. This column summarizes the value of this
response header; text/html is the type of this one.
|
| Initiator | Other? This may seem like a bit of a cop-out, but what Chrome is really telling you was that it was not internally responsible for this request — here, I was. I'll explore the use and meaning of this column more below. |
| Size/Content |
As I mentioned before, an HTTP response is a status line, followed by
(strictly optional but invariably present) headers, followed themselves by (again
optional) content such as a web page or a .jpeg image.
The size of the response is the number of bytes composing the
status line, the headers, and the content; the content is, of
course, the actual content. Here, the web page is exactly 50 bytes long,
including markup, but there were an additional 297 bytes of HTTP header.
|
| Time/Latency |
Time is how much actual time elapsed between the writing of the
first byte of the HTTP request and the receipt of the last byte of the HTTP
response. Latency, on the other hand, is the total time minus
the time spent doing actual work (i.e. the time spent in the network).
|
| Timeline |
The timeline column seems like overkill for such a boring page and in this
case, it is. If you hover over the red line, a tooltip will appear reporting:
"Load Event" and if you hover over the blue one, the tooltip will report:
"DOMContentLoaded event". The load event is when the Javascript handler for
window.onload was called (whether the page provided a handler for
it or not), and the DOMContentLoaded refers to the
firing of the handler window.DOMContentLoad. In general,
onload is the last thing that happens before the user sees a web
page — I'll talk more about these below. In this case, these happened at 148 ms (after the first byte of
the HTTP request was written to the socket), which
is also summarized in the footer area at the bottom of the display.
It's actually unusual for If you hover over the bar itself, you get a display like the one shown in figure 2. This breaks down exactly what the socket connection was doing for the reported 146 ms. As you can see, it spent about half of its time connecting and about half waiting. The waiting time actually works out to be the time the server spent parsing the HTTP request and assembling the correct HTTP response. |
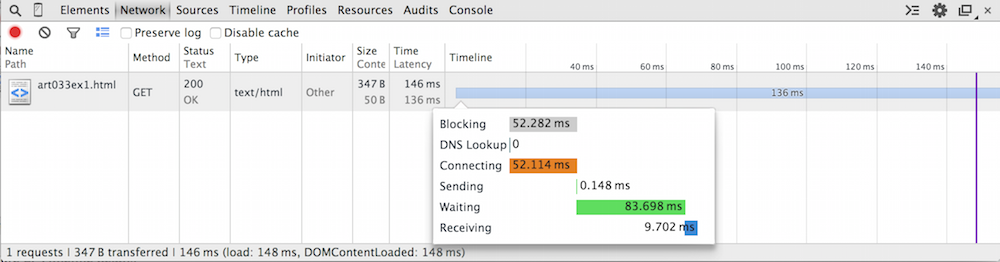
Figure 2: Timeline details
If you actually click on the resource (where it says "art033ex1.html"), you'll get a more expanded view of the client/server interaction as show in figure 3.
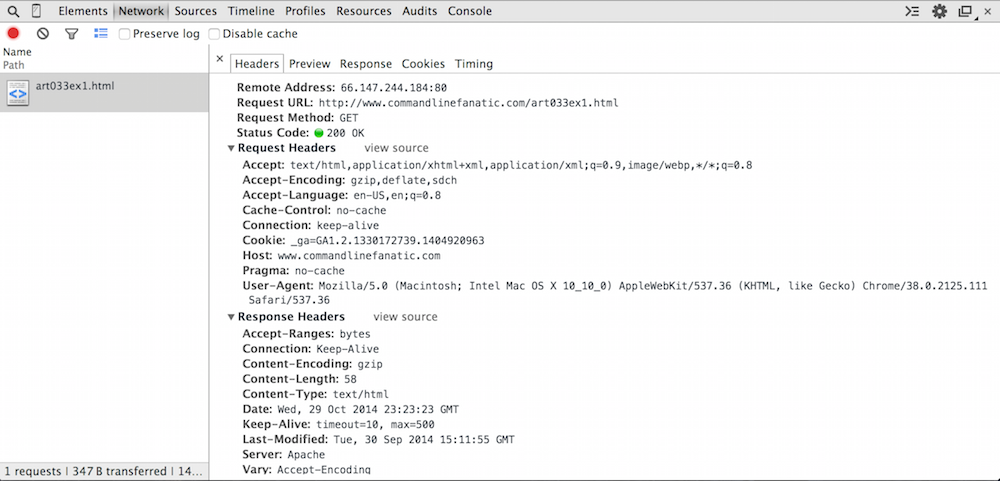
Figure 3: HTTP headers view
I mentioned the HTTP protocol in brief above. I'll be a bit more precise as I
go through the contents of the Headers subtab of the
Network tab. HTTP consists of clients sending requests
and the server replying with responses. Collectively, HTTP requests and
responses can be referred to as generic entities and in fact, they
share quite a few commonalities. I mentioned before that an HTTP response
consists of a status line, optional headers which are name/value pairs, and an
optional body. In fact,
an HTTP request is structured the same way — a request line, optional
headers, and an optional body — the HTTP request body is crucial to form-handling
and POST requests as I'll demonstrate below. Bear in mind as you
read through this that only the client sends requests and only the server sends
responses and then only in reply to a request.
First, notice that the top part is the Remote Address. This
isn't strictly part of HTTP but instead the TCP protocol that HTTP runs on top
of; the first thing the browser did was to establish a TCP connection with
the IP address 66.147.244.184 on port 80, the WWW/HTTP port. Recall from
figure 2 that it spent 52.114 ms doing so.
The Request URL is exactly what I typed in the URL bar.
The Request Method and Status Code are repeated as shown in the summary table in figure 1.
Below these are the request and response headers themselves. As you can see, there are quite a few — I said before that they're optional and strictly speaking this is true, but virtually every HTTP request or response includes quite a few headers that describe to the receiver what to do with the entity. The request and response headers shown here are the actual HTTP protocol itself. The Remote Address, Request URL, Request Method and Status Code at the top are summaries and auxiliary information — what you see below is the actual HTTP part itself.
However, even what you see in figure 3 is slightly summarized for easy consumption. The header
names are shown in bold, and they're alphabetized. If you want to see
exactly what was exchanged between the browser and the server, click
view source as shown in figure 4.
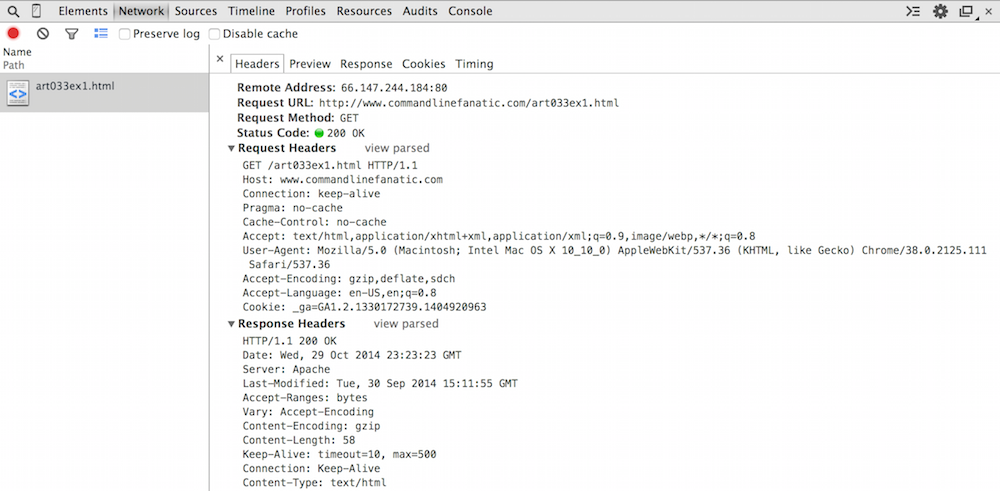
Figure 4: Raw detail
Recall from example 1 that the first part of an HTTP request is a verb such
as GET or POST. Here you see that the very first
byte of the HTTP request was the "G" of GET — nothing else
was exchanged over this socket before this. If you're really feeling
adventurous, you can verify this with a packet sniffer like Wireshark.
This request line, describing that the client would like to see the resource
named art033ex1.html, is followed by 9 headers providing more
detail about exactly how it would like to do so and what the server should
provide if possible. I won't review them all — if you're curious, see
the IETF specification — but there are a few important points here.
First of all, the first header is the Host header. I said before
that the header lines of HTTP Entities were optional. Strictly speaking, this
is true, but at a minimum, every HTTP request will include the Host
header indicating the web URL it connected to. This may strike you as
redundant — after all, the server know where it is, right? Well, actually,
in the early days of the web, shared hosting was common, and one IP address
would be responsible for many individual websites, so it was necessary for the
client to remind the server which one it actually wanted.
The Host header is followed by probably the second-most important
header in the request, the Connection header. Again, the need
for this header goes back to the early days of the web. Notice that the request
line ends with the token HTTP/1.1. This refers to the version
of the HTTP protocol being requested, 1.1. There was a 1.0 that was
fairly popular before 1.1 was specified in 1999. One significant issue with
1.0 was that the client signified that it was done sending its request by
closing its socket, which wasted sockets. With 1.1, the client must indicate
whether it will close the socket or keep it alive awaiting the response, with
the Connection header.
The response headers, below the request, indicate that the server returned a 58 byte gzipped (compressed) response.
Recall from figure 1 that the response, when uncompressed, was 50 bytes. Compression actually made the response bigger! This is common for short messages; see here for more detail on how GZIP compression works.
But surely you must be wondering now... where is that body? We're seeing the
low-level details of the HTTP protocol here, so the body must be in there
somewhere, but it's absent from figures 3 and 4. The Preview and Response tabs both
show the response (in this case, identically) as illustrated in figure 5. This is
not what the server actually sent; the server in this case sent back
a gzipped (compressed) version of the page, which Chrome uncompressed and
displayed to us. There's no way to see the true, raw response from the server
in Chrome — you'll have to use a packet sniffer such as Wireshark if you
want to see that level of detail.
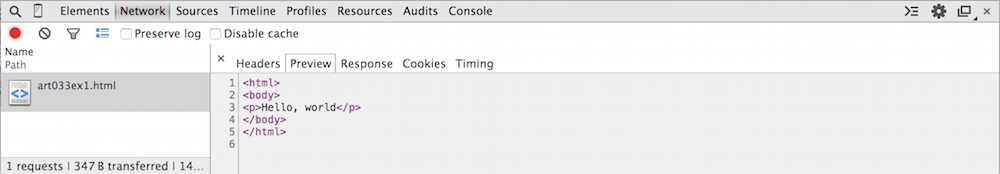
Figure 5: HTTP Response body
There are two tabs remaining; Cookies and Timing.
Timing shows you the same data as in the hover-over displayed in
Figure 2 — Cookies, shown in figure 6, summarizes two fairly important request
and response header values, the Cookie and Set-Cookie
values. The cookies tab will be absent if the request neither
sent nor got any cookies.
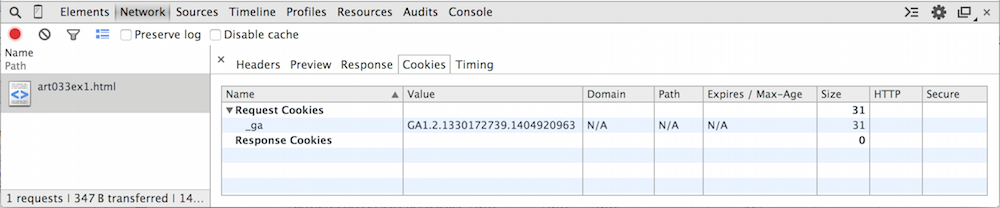
Figure 6: Cookies
You can match the one line of figure 6 up with the HTTP request header line in Figure 4:
A
Cookie: _ga=GA1.2.1330172739.1404920963
cookie is just a name-value pair with particular meaning to
a web server instance. A server sends cookies along with an HTTP response and
the client must respond with the same cookie each time any resource is
requested from this particular server. This is how web servers accomplish
personalization. The server does have the option to further restrict which
cookies it wants by providing a domain and a path to which the cookie is
relative; if these are included in the cookie response from the server, they
specify under which circumstances the client should return this cookie.
Cookies can additionally have expiration times after which the client should
stop sending them. Finally notice that the size of this cookie is
reported as 31 bytes — this is the size of the name/value pair that was
supplied by the client to the server, including the delimiting =
sign, but excluding the Cookie: preface.
The cookies tab may not seem particularly useful right now — after all, you can
just read the request and response headers to see the cookie contents —
but when you start dealing with dozens of cookies, the utility of having their
contents broken down in a readable way becomes evident.
Now, if I hit the refresh button on my browser, the display changes a bit, as you can see in Figure 7.
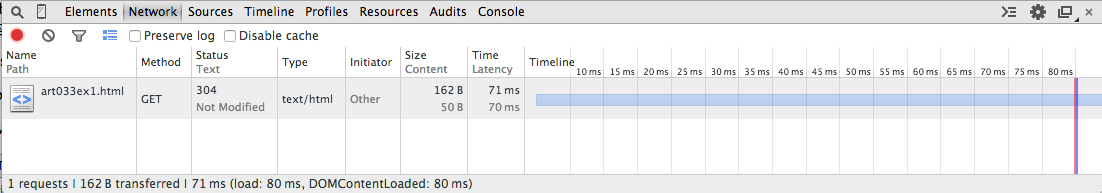
Figure 7: Not Modified
Here, I see that my browser submitted the same GET request it submitted in Figure 1. However, since I had a cached version, the server responded with a304 Not Modified status, telling me that it was OK to go ahead
and use my cached version. But how did it know that I had a cached
version? A clue can be seen if you look at the request headers, shown in
Figure 8 below.

Figure 8: If-Modified-Since header
You can see that this time, the browser included the new header
If-Modified-Since, which informs the server as to when the
resource was cached — if the server doesn't have a newer copy, it
responds with a 304 and an otherwise empty response which
instructs the browser to render the cached copy. The first request did
not include this header (peek back at figure 4 to see), so the server
did respond with the full page. Note that if you click the Preview
or Response tabs, you'll see the full HTML response — what
you see is the cached copy, not what the server sent back, since the server
didn't send anything.
As you probably know, though, very few web pages can be fetched in a single
GET request. Real web pages have style sheets, scripts, images
and sometimes video files or multimedia objects. These are fetched by the
browser one at a time as it discovers them. In an ordinary page request, a
web page's HTML source is first downloaded. Chrome then parses the HTML, discovering
additional resources that are needed to render the page correctly. These
consist of <img>, <script>,
<link> tags — anything with a src or
href attribute. These are then automatically downloaded in
separate HTTP GET requests. You can see this in figure 9, where
I've downloaded the home page of commandlinefanatic.com.
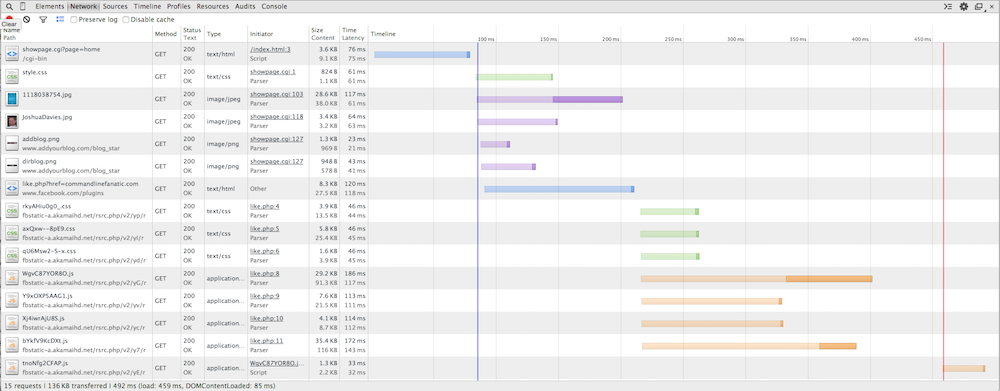
Figure 9: A more complicated page
The first line shows the download of index.html. It took a little
under 100 ms to open a socket, stream the request, and receive the response.
You can see a slight pause — about 10ms worth — while Chrome
parsed the HTML source. It then initiated 6 concurrent downloads for
stylesheets, images and the "like" code from Facebook that is
iframe-ed in the right rail. This is where the
initiator column starts to become interesting ‐ we can now
see that the stylesheet was downloaded because of line 1 of
showpage.cgi. This can be very helpful information, especially
when one of your resources is erroring out with a 404. I have a Facebook
"like" button on my homepage which is loaded in an iframe —
you can see from the network trace that the source of this iframe was loaded
and kicked off its own related set of downloads, all of which had to be
retrieved and parsed before window.onload (the red line) was
invoked.
There's a color-coding going on here that doesn't seem to be documented anywhere, although it's easy to determine what's what. Requests for documents such as HTML or XML are shown in blue, stylesheets (CSS) in green, images in purple, scripts (Javascript) in orange. There are other classes of requests with their own colors which I'll discuss further down.
I showed you in figure 5 what happens you "preview" an HTML response. What
about an image? If you click on one of the images in the response stream,
you see the actual image and a brief summary of the image metadata as shown
in figure 10. What was actually streamed back from the server was pure binary
data, however. Again, Chrome won't show you this level of detail; if you click
on the Response tab, you're just told that "no data is available".
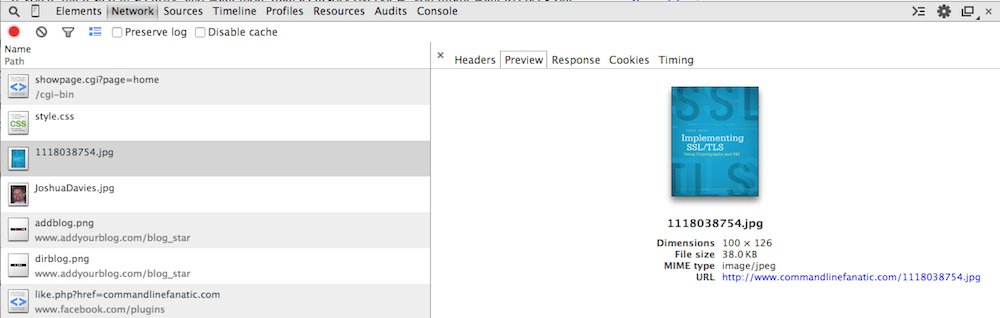
Figure 10: Image preview
Another interesting point about this request is illustrated in figure 11.
Here you see that the request was a GET, just like the one from
figure 1, but it included some request parameters. These are summarized in
the headers section in between request headers and response headers. In this
example, the query string is simple, but just like the Cookies
tab from figure 6, this view can be very handy when dealing with complex
requests.

Figure 11: Query String Parameters
This is still a relatively simple page, and even so it's pretty hard to navigate, even with the helpful color coding. If you want to narrow down to exactly what you're looking for, there's a helpfulfilter
option illustrated in figure 12 that lets you view only certain types of
requests. I find this most useful narrowing down documents and XHR
(XmlHttpRequest, which I'll talk more about below).
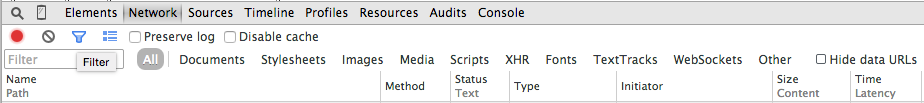
Figure 12: Filtering log elements
All of the examples so far have been HTTP GET requests. Although
there are 7 other HTTP verbs, the only other particularly common one is
POST, which is how long pieces of data are transmitted from the
client to the server. There's actually a bit of overlap between GET
and POST, since GET requests can provide additional
data via query parameters but strictly speaking, POSTs should be
used when the user is providing data to the server and GET when
the user is just requesting something (e.g. a web page). The most prominent
example of the user "providing" something to the server is a form submission
such as the comment section of my blog. The user provides their name, e-mail,
and a comment and POSTs it to the server, where it's inserted
into the comment database and becomes part of the page content. Figure 13
illustrates the resulting POST request. First, notice the
request header line — instead of GET, it performed a
POST, since the forms method attribute specified so
(which is also the default if you don't declare anything). This tells the
server to expect a request body — you can see that the request now
has Content-Length and Content-Type headers. This
isn't the case for GET requests, since GETs don't
(and can't) have content.
The content itself is shown where the query parameters were in figure 13 as
Form Data. Here I've expanded the source view to show exactly
what was passed over the socket; as you can see, this looks a lot like a
GET query string. The difference here is that it wasn't passed
in the first request line, but instead as 99 bytes of content after the last
header line.
As you can also see, I don't have any sort of CAPTCHA in place, so I've been plagued by comment spammers. At the moment, comments are disabled until I can upgrade to a better spam catcher.
One last interesting thing to pay attention to in figure 13 — the response
from the server was not a web page at all, but a code 302. The terse server
response text for code 302 is just Moved, which indicates that
the client should look for the Location header and issue a
GET request for whatever it finds there. In this case,
it's being directed to reload the article page, focusing on the comments since
the viewer (presumedly) just added one. You can see in the network trace that
the next request was, in fact, a GET request for this page.
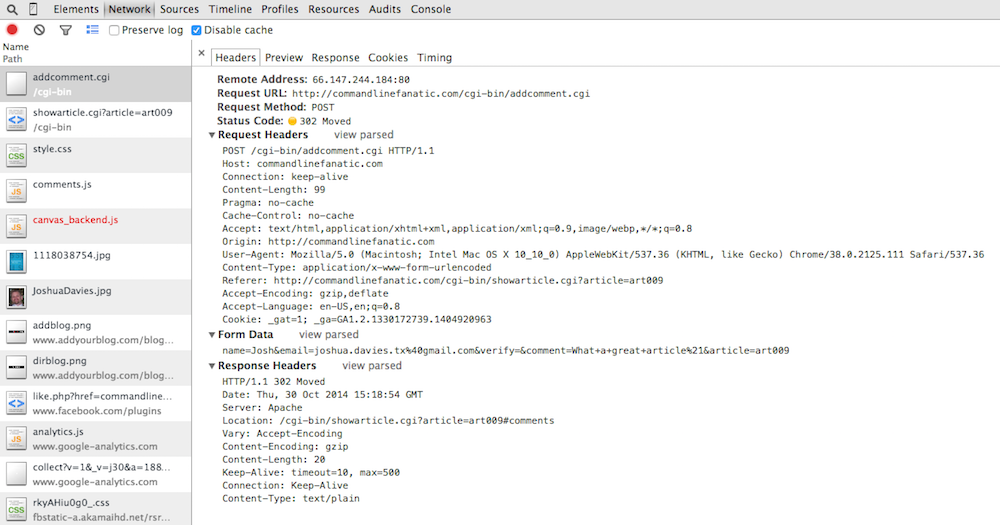
Figure 13: Form Post
Figure 14 illustrates how basic authentication is handled; if the server has
identified a resource as "protected" (how to do so varies from server to server),
it will respond with a 401 Authorization Required status.
Interestingly, you don't see this in Chrome; Chrome instead shows you a
"pending" status as illustrated in figure 14. You can see this if you
go to the example
on this site.
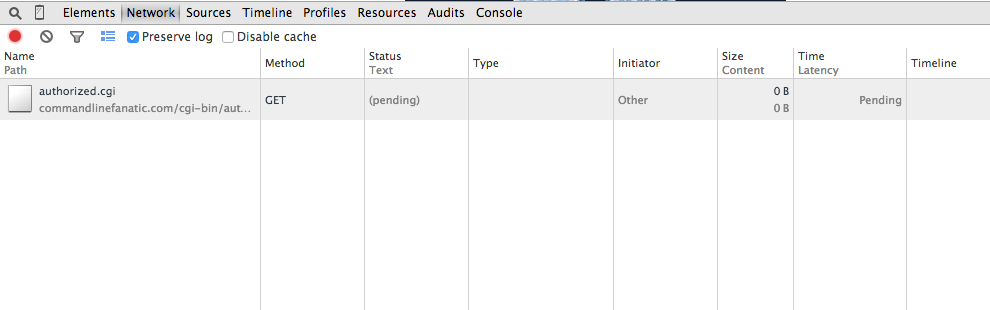
Figure 14: Awaiting Basic Authorization
If the server rejects the user's credentials, the server responds again with
the same 401 Authorization Required response. However, Chrome
hides this from you; the display doesn't change until you hit cancel, when it
shows you that there was one or more 401 Authorization Required
responses going on behind the scenes as shown in figure 15.
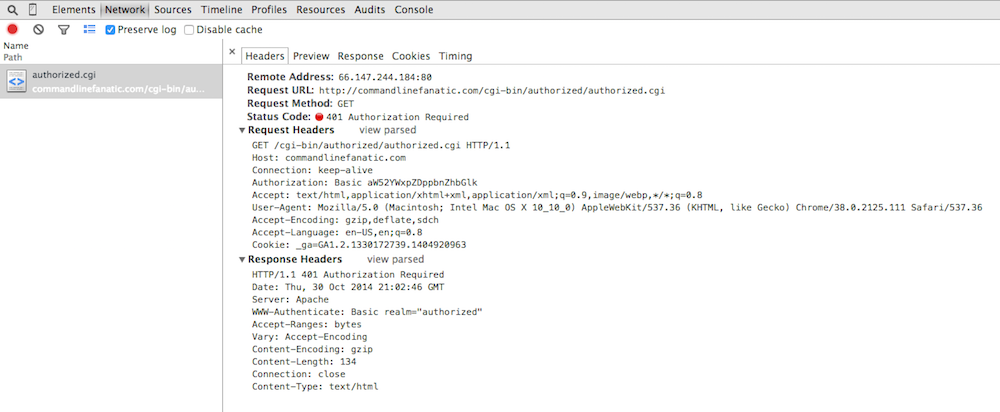
Figure 15: 401 Authorization Required
This view is slightly misleading, but good enough for diagnostic purposes.
Here, it looks like my browser made one request with the header
Authorization: Basic aW52YWxpZDppbnZhbGlk and got back one
response with the status Authorization Required. In actual fact,
my browser sent an ordinary GET request with no Authorization
header. The server challenged back with the response that you see in figure 15,
including its own WWW-Authenticate: Basic realm="authorized"
header indicating to the browser what type of authorization it was prepared
to accept. I then typed in "invalid/invalid", which the browser concatenated
into "invalid:invalid", base-64 encoded, and sent back as a repeated
GET request with the header you see in the figure. The server
responded with the exact same 401 Authorization Required (it's
snarky way of saying, "wrong password"). I then pressed the cancel button and
the network tab updated to see what I've shown you in figure 15.
Figure 16 illustrates a successful authorization — in this case, you
don't even see that there was a 401 Authorization Required response
involved at all! Chrome's perspective is to let you see what's important;
here, the fact that there was a get followed by a response is really what you
need to know.

Figure 16: Successful Authorization
The last thing I want to show is how Chrome tracks XmlHttpRequest (AJAX).
Since its release, Chrome has always been on the forefront of cutting-edge
HTML, so it should be no surprise that Chrome has robust support for AJAX
techniques built into its debugging tools. Example 3, below, is a simple
AJAX-based web page that does nothing particularly special besides illustrating
AJAX — it just loads another page inside a DIV.
<html>
<head>
<title>AJAX Example</title>
<script>
window.onload = function()  {
	var xhr = new XMLHttpRequest();
	xhr.onload = function() {
		var d = document.getElementById("target");
		target.innerHTML = this.response;
	}
	xhr.open("get", "art033ex1.html", true);
	xhr.send();
};
</script>
</head>
<body>
<div id="target"></div>
</body>
</html>
Example 3: Simple AJAX example
The network response is illustrated below, in figure 17. The blue line shows
the request for example 3, and the light yellow
line shows the AJAX request that was kicked off by its onload
script. Of particular interest is the fact evidenced by the initiator
column that the main page was loaded by "other" (e.g. my browser), but
art033ex1.html was loaded by a script — specifically, line 12, the
xhr.send() line. You can see that the XHR lines up exactly
with the vertical red line — this make sense, since as you may recall,
the vertical red line tells me when window.onload was invoked.
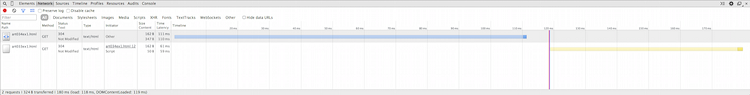
Figure 17: XMLHttpRequest (XHR) network trace
Since this was a simple example, it looks from a network perspective just as
if it were an ordinary GET request — the only way you can
tell the difference is that its initiator was a Script, and the
color of the network timing line is different. If the request had been more
complicated — e.g. a POST with a JSON body in the request
as well as in the response, clicking on the resource would show you what was
passed back and forth, which can be very helpful troubleshooting problematic
AJAX requests.
Next time, I'll cover the real workhorse of the Chrome debugger tools, the
Sources tab — the sources tab is a mini-IDE in and of itself,
with the depth and complexity to match.