You kids and your fancy debuggers, these days. Back in my day, we had to
debug Javascript in IE 4 using nothing but alert() popups. If we got stuck
in a loop, IE would idiotically keep alert()-ing us until we killed the
browser manually (which, incidentally, wasn't always that easy to do). The
state of the art in Javascript/client-side debugging has come a long way since
those days; I hardly ever have to code alert()s any more. These
days, my weapon of choice is Chrome; it comes with a built-in debugging
extension that, for the most part, can do everything I need it to do.
Although Google maintains very good, comprehensive documentation of the Developer Tools, including keyboard shortcuts and different modes of execution, the documentation does a good job of telling you what there is but not necessarily the context that you might want to use it in. When approaching a new tool, I find it easier to start from the basics and work up to the more complex cases. Starting with the simplest possible web page, shown in example 1:
<html>
<body>
<p>Hello, World</p>
</body>
</html>
Example 1: a very simple web page
I'll walk through all the major features of the elements tab
of the Chrome developer tools. Click here to open in a separate tab and follow
along with this tutorial (unfortunately, you'll have to switch back and forth
between that tab and this one to do so). Now, open up the chrome developer
tools and take a look at the result.
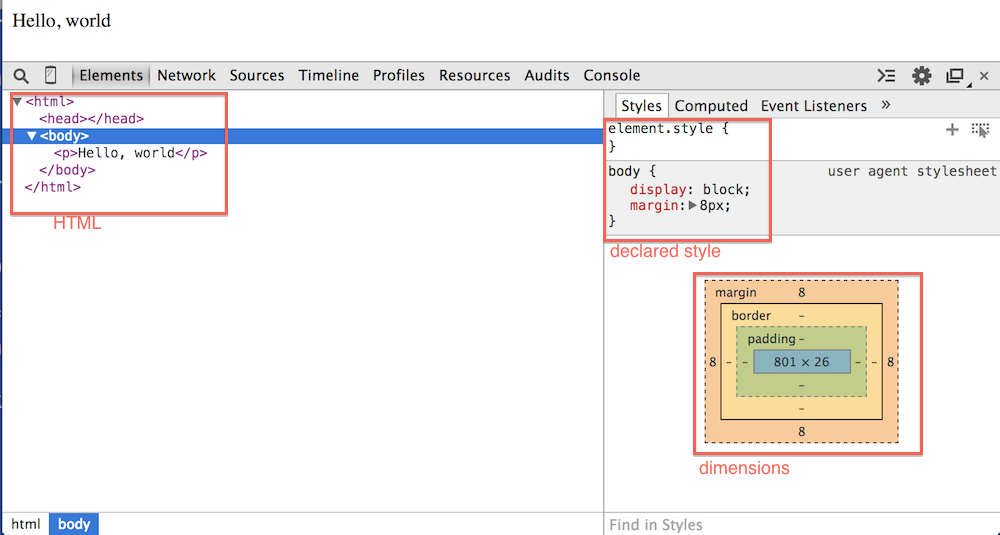
Figure 1: Chrome debugger tools
On the bottom left, you see the HTML in pretty-printed form. Disclosure
triangles allow you to collapse and expand any nodes with children to get a
better view. Notice that, although the text <head></head>
doesn't appear anywhere in the source listing, Chrome added one to make the
HTML valid (it will do this if you omit the html tag as well —
even the body tag!)
On the bottom right, you see the declared style of the selected
element. By default, the body tag is selected in the elements area, so you see the
dimensions of the page body — if you resize your browser, you can see
this change. In figure 1, you see a brown margin box surrounding a
yellow border box surrounding a green padding box finally
surrounding a blue 801 x 26 box which is the actual dimension of the
body element — it's 801 pixels wide and 26 pixels tall (since the
debugger tools take up most of the display in this example).
If you click the html element in the elements area, notice that the reported size changes —
the html element reports that it is 817x50 pixels; 16 pixels wider and 24 pixels taller than
the body element. This is the actual width of the viewable area
on the screen (you can verify this with a ruler tool). So why is the
body smaller than the visible screen? There's a clue in the
size block, if you click back to the body element; the brown margin
box contains the number "8" four times, once for each side. These are the
margins of the element; the body will be offset by its parent by 8 pixels on
the top, right, bottom and left. The body starts 8 pixels below and 8 pixels
to the right of the viewable area and ends 8 pixels to the left and bottom.
But... that explains why the body is 16 pixels slimmer than its parent, why is
the body 24 pixels shorter than the visible area?
If you click the <p> tag, you can see that it declares a
-webkit-margin-after of 1em; — this forces the
bottom to be 16 pixels (at this font) below the bottom of the nested
p tag.
If you hover over the body element in the HTML view in the lower left, you get a visual depiction of the computed size of the element you're hovering over as depicted in figure 2.
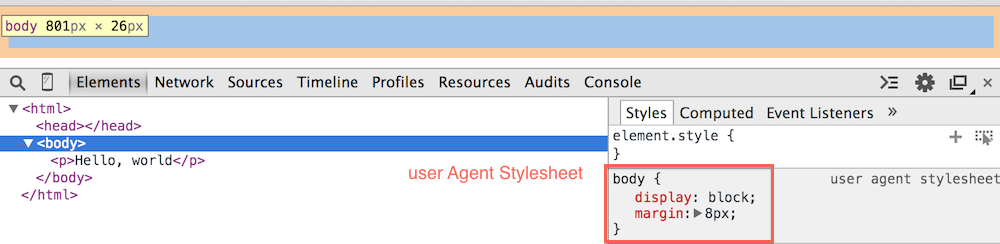
Figure 2: Hovering over an element
Just above the size display are the CSS styles that contribute to the
presentation of the element. This may be a surprise, since as you can see,
there are no CSS styles associated with example 1. However, browsers
associate default styles with each element which can optionally be overridden
by page or user style sheets. Here you see that the body
element has two style declarations in the "user agent stylesheet" (i.e. the
default): display: block and margin: 8px. Notice
that this reads like a valid CSS declaration, although it doesn't actually
appear anywhere in your source code nor is it editable.
Above the user agent stylesheet declaration is a declaration called
element.style. This shows you any inline styles (that is,
declared via the style attribute) that are present on the element.
In this case, there are none, so the declaration is empty. Notice that there's
a "+" icon next to it; if you click it, you'll get a new style declaration as
shown in figure 3.
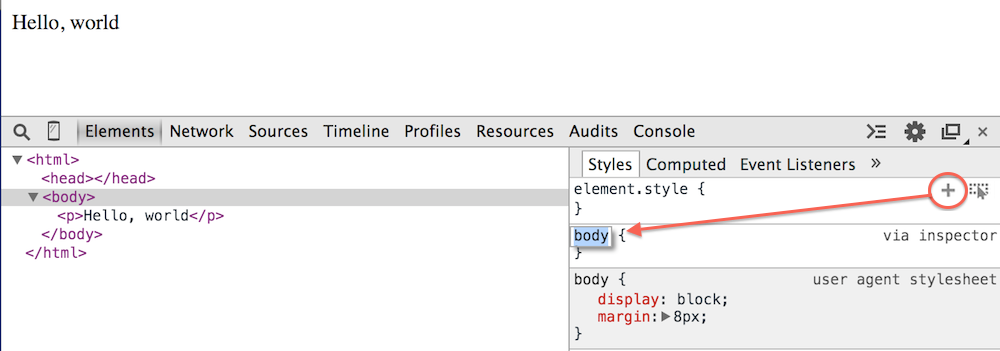
Figure 3: Overriding styles
Notice first of all that the element.style part didn't become
editable; instead, Chrome inserted a valid CSS selector below it that would
match the selected element and left the styles open. You might logically be
inclined to think that this "+" is somehow related to the element's inline
styles, since it's right next to the element.style declaration,
but this isn't the case; it's just located there for compactness' sake.
You get a chance to override the provided selector with your own more specific (or even completely different) selector. If Chrome doesn't think that the selector you specified matches any elements in the document, the selector will appear in a faded grayish color.
Notice that I said "doesn't think" - I've observed that, at least in version
37 that I tested with, even if a matching element appears in the DOM body,
Chrome won't realize it until you explicitly click on it. So in example 1,
if you override the provided selector with p, the selector will
initially appear greyed out until you click on the p tag. This
is probably a bug, but a relatively minor one.
You get a warning that this is "via inspector" to remind you that it didn't come from the page or the browser itself. If you click inside it, you get an editor where you can type in new CSS styles; if you start typing, you'll get an auto-suggest list of styles that the browser recognizes, as shown in figure 4.
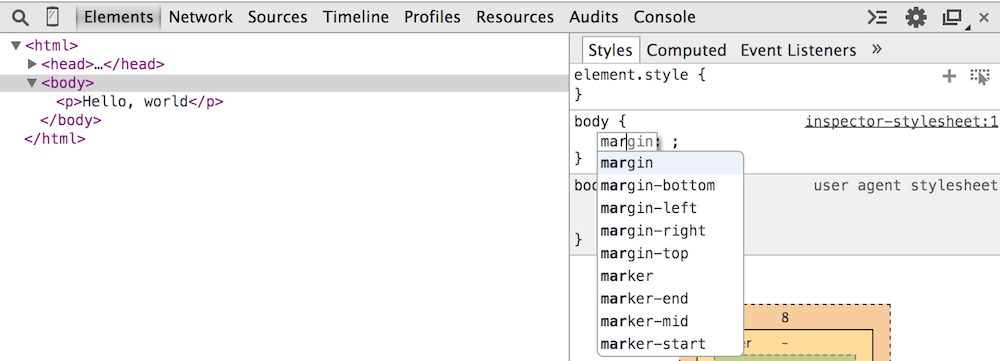
Figure 4: Setting overridden styles
Change the border and the margin of the body element to 1 px solid black and 4px respectively; notice that the size disclosure updates as does the display.
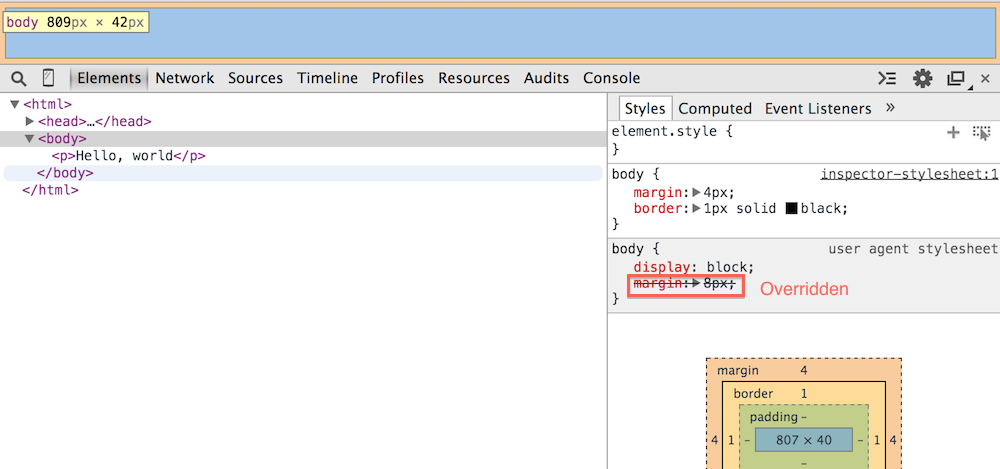
Figure 5: Viewing the style override
Notice also in figure 5 that the user agent stylesheet margin
property appears crossed out; Chrome treats inspector stylesheet properties
(along with almost everything else) as having higher precedence than user
agent stylesheets so the user agent's 8px margin is no longer applicable.
If you hover over the newly introduced properties, a checkbox appears next
to each one; you can enable and disable properties one by one by checking them
on and off. Once you've added an inspector stylesheet property, the only
way to get rid of it is to uncheck it or refresh the page; there's no "delete"
option here. Notice also that there's no way to disable or edit the user agent
"stylesheets".
So far, we've just been looking at the Style tab. You can see that there's
another tab to the right of it, the Computed tab. If you click
on it, it will show you how the styles that apply to the selected element
"cascade" together, and expand shorthand styles like margin and
border into their long formats border-bottom-color,
border-bottom-style, margin-top,
margin-right, etc. as shown in figure 6. Notice that some of the
properties here include disclosure triangles and some don't; the ones that do
are the ones that were set by your page (or a related stylesheet), and the
ones that don't were defaulted by the browser. If you expand the triangle,
Chrome will show you where the style was loaded from (user agent, stylesheet,
or inline element) and hyperlink to the source if possible.
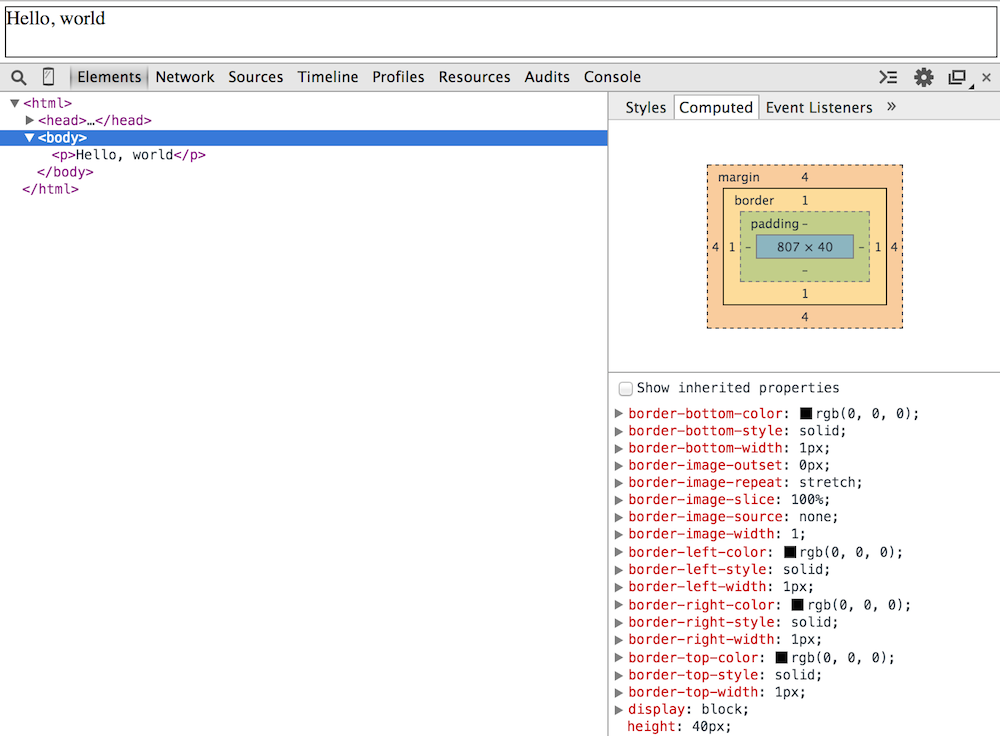
Figure 6: Computed style
You can also get to Event Listeners and DOM Breakpoints from here; I'll come back to these when I look at the Javascript debugger in a later installment.
There's a fifth tab; you might have to click on the arrows on the right to get to it (figure 7). It's called Properties.
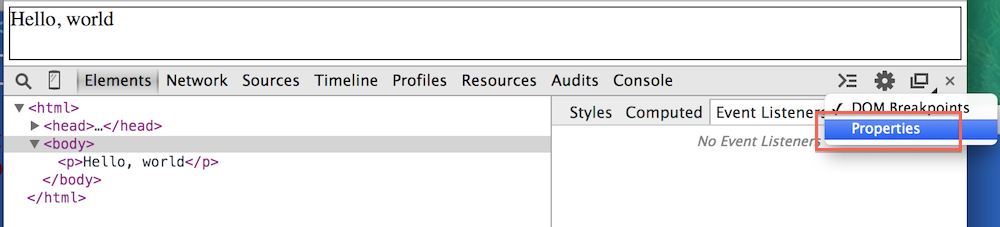
Figure 7: Some "hidden" tabs
Every HTML element is a DOM object; as such, it has properties and
a parent class. The Properties tab shows you the inheritance
hierarchy of the selected DOM node (HTML element) along with all of its
properties at each level of inheritance. As you can see from figure 8,
although the body tag takes up a scant 13 characters in the HTML
markup (including the closing tag), it has quite a few properties in the DOM.
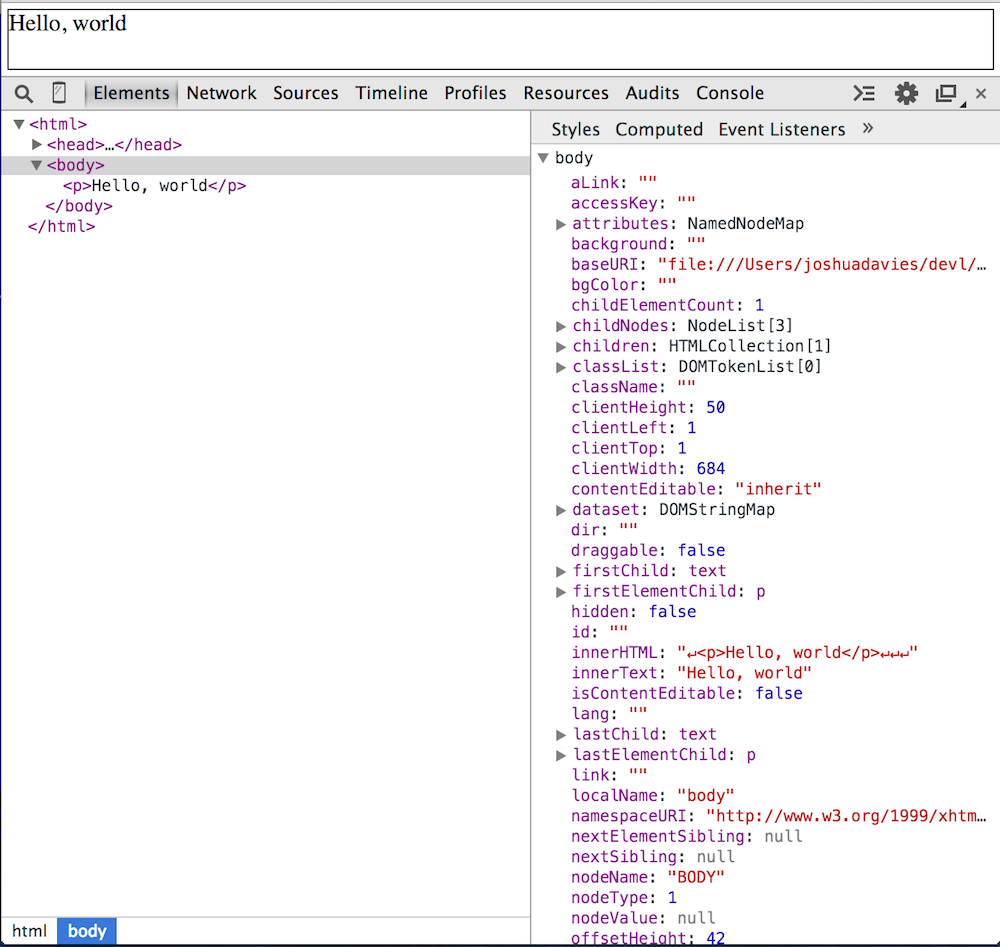
Figure 8: body properties
The body tag inherits the HTMLBodyElement class,
which inherits the HTMLElement class, which inherits the
Element class, then the Node class, then the
EventTarget class, and finally the Object class.
If you refer to this element in Javascript, for example, this is the list of
properties and functions you can invoke on it.
Any HTML attributes defined on the element will also appear as properties. If
you'd like to see this, you can right-click on any element and set its
attributes right there in the debugger. The HTML in example 1 only has two
HTML elements, neither of which permit any attributes that are recognized by Chrome
(or any other modern browser), so try the code in
Example 2, which is a bit more interesting.
Depicted in figure 9, this is a list of all of my commandlinefanatic
posts.
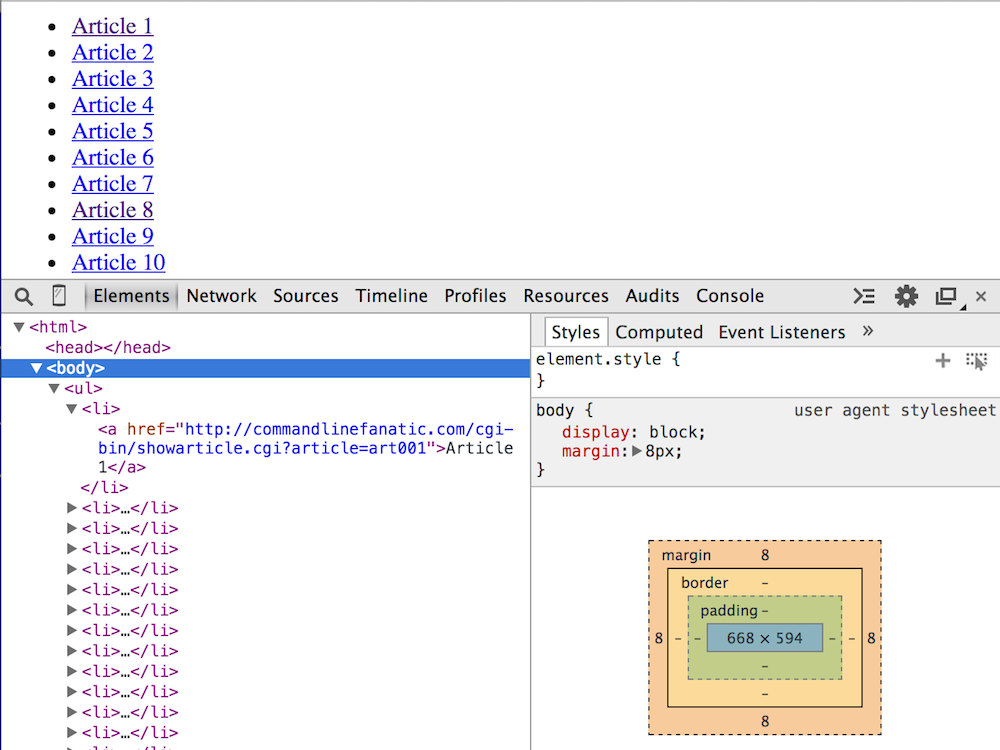
Figure 9: list of links
If you hover over any of the links, you get a tooltip as you might expect, but
you just see the bare URL; none of them have title attributes
which permit the tooltip to be customized. If you right-click on one of the
a anchors and select "Add Attributes" as shown in figure 10:
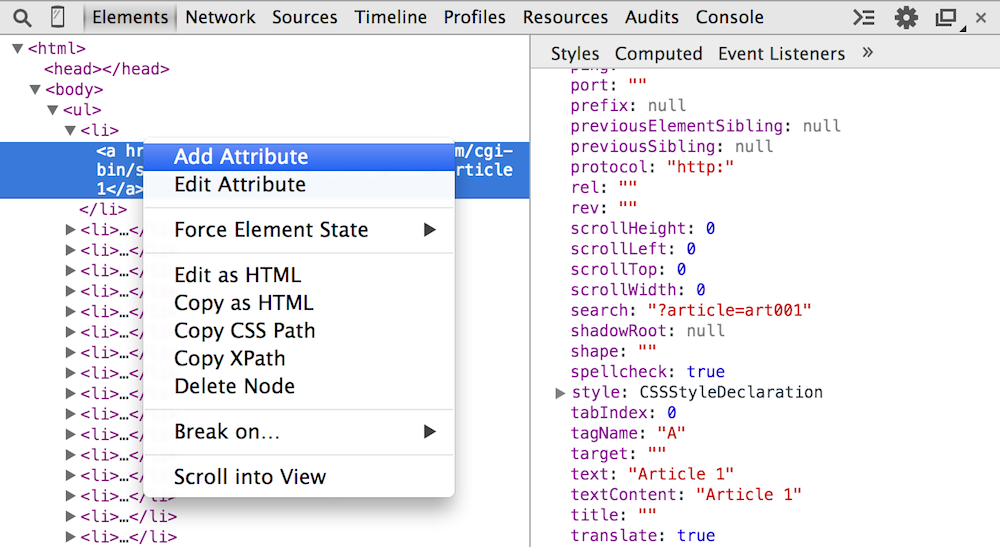
Figure 10: Add Attribute
You'll be given an option to insert a new attribute as shown in figure 11. Whereas the stylesheet editor (figure 4) will auto-complete for you, the HTML attribute editor doesn't, unfortunately, so you'll need to keep closer track of your HTML syntax if you want to use this.
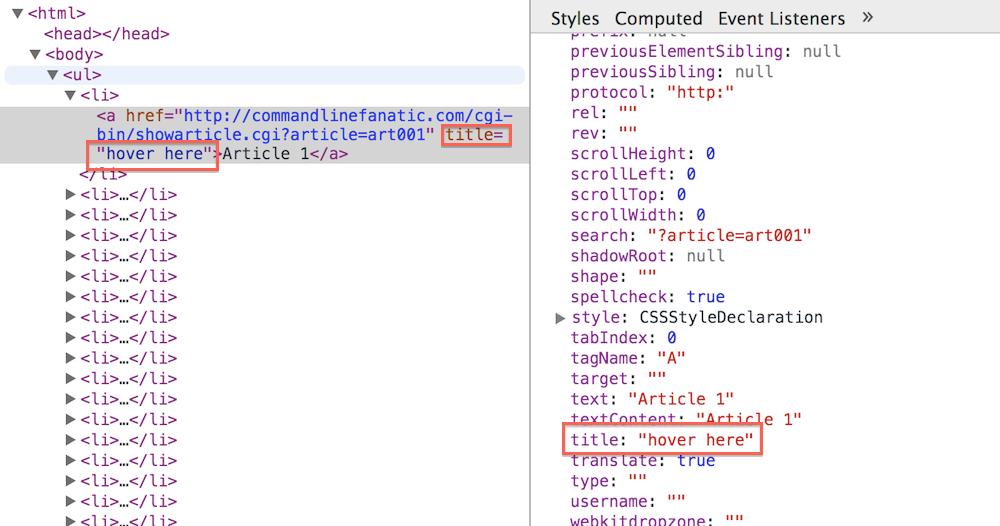
Figure 11: New title attribute
Notice also that the title attribute is reflected in the
Properties tab view to the right (although I had to click off
and back on the element to get it to refresh when I was testing this). You
can also edit attributes, edit the entire tag, or even delete it completely.
If you edit the tag and add markup after it, the markup will be parsed and
inserted correctly into the document. Be aware that you're not
changing the source document; if you refresh the page, your changes will be
lost.
If you scroll to the bottom of the page in the upper pane — the one that
shows you the rendered view that your page visitors will normally see — the
HTML source view in the lower pane stays in the same place it was. You can,
however, right click on an element and click "Scroll into view" to reveal it;
then, if you hover over it, you'll see it highlighted in light blue in the
rendered view on top. Note that if the visibility of the element is set to
none via CSS, you won't be able to "see" it when you hover over
it, nor will you be able to scroll it into view. If scrolling and hovering
over an element don't seem to be accomplishing anything, check to see if you
accidentally set the display to none. Interestingly, this only
applies to display: none not, for instance,
visibility: hidden.
You can go the other way as well; if you right-click on any element in any
HTML view, whether the debugger is open or not, you'll get an option to
"Inspect Element" which will open the debugger, navigate to the element
tab, and select the element that you asked to inspect.
As you are probably already familiar, page authors can specify CSS in four
different ways: inline style attributes, inline style tags,
external stylesheets, and included stylesheets.
Example 3 is a revamped version of example 1 that
includes styles declared in each of these ways. Figure 12 shows the p
tag that declares its styles inline; as expected, the element.style
part of the Style tab reflects the inline style. You can uncheck
this or edit it as before.
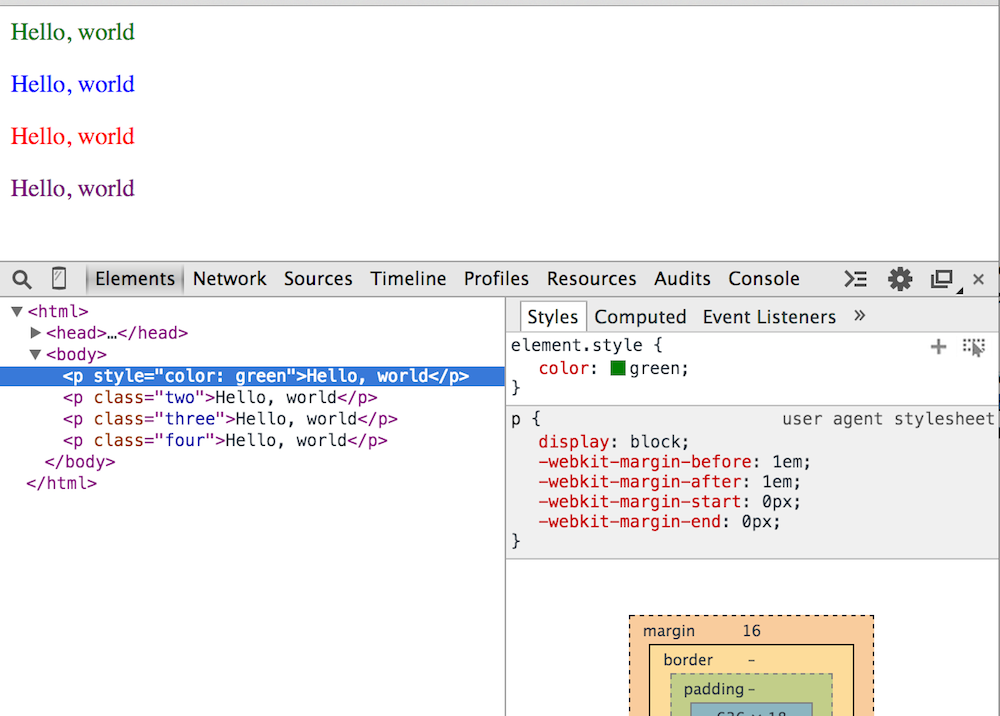
Figure 12: Inline element style attribute
If you click on any of the others, as shown in figure 13, you'll see the actual CSS selector that was responsible for styling the element, along with a hyperlink to the source file that it came from. I'll talk more about the source view when I get to thesource tab.
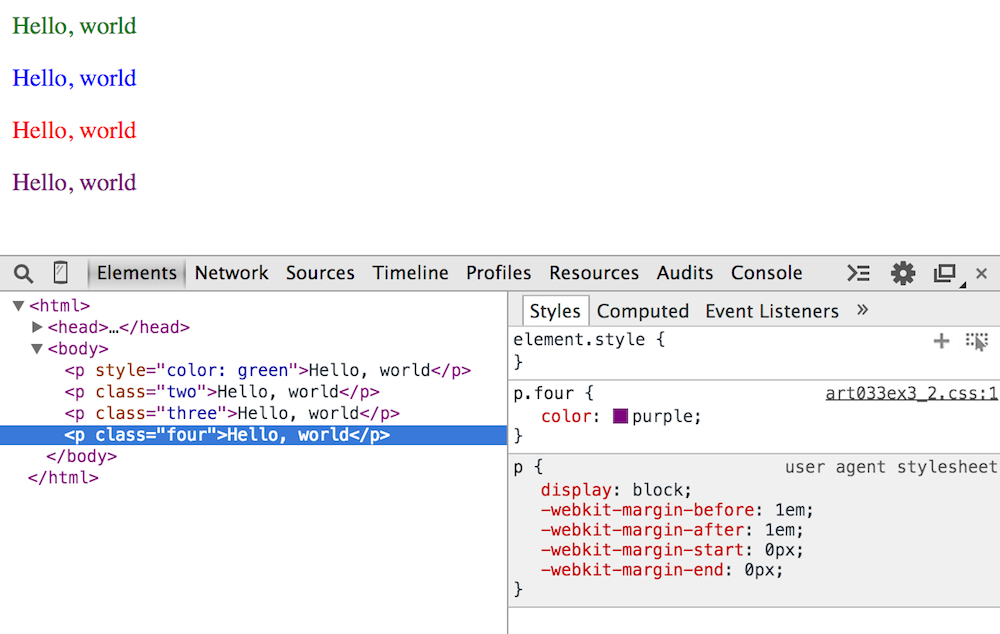
Figure 13: source tab hyperlink
I mentioned before that if you click the "+", Chrome will suggest a CSS
selector for the new element you're adding. In figure 3, this was
body, because that's the tag I had selected. If the tag declares
a class or an ID, Chrome will include it in the suggested selector, preferring
IDs over classes. It won't, however, try to infer the tag's position within
its parent tags - in other words, if you have the following markup:
and select the first item in the elements area, the suggested selector will
be
<ul>
<li>Item 1</li>
<li>Item 2</li>
<li>Item 3</li>
<li>Item 4</li>
</ul>
li, rather than the more specific ul li. Nor will
chrome default any attributes beside the id or class.
However, if you right-click on any element, you will see a menu option "copy
as CSS path" which will infer the most specific CSS selector it can from the
HTML structure and insert it into your clipboard to be pasted either in the
inspector stylesheet or an external stylesheet. If you selected the second
child in the list above and clicked "copy as CSS path", you would get the
very specific selector body > ul > li:nth-child(2), ready
to be copied into your stylesheet or your new inspector style.
In fact, you can style an entire page using just plain HTML and Chrome's
debugger as though it were a CSS IDE. If you create new styles in your
inspector stylesheet, you'll notice that inspector-stylesheet is a
hyperlink as shown in figure 14; you can click through it and see a valid
CSS file that you can save locally. This takes you to the source
tab in the debugger tools; I'll cover this in more detail later.
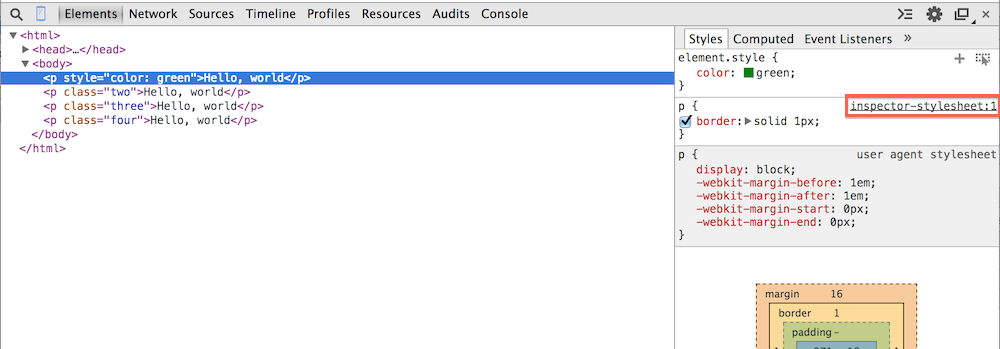
Figure 14: inspector-stylesheet link
HTML, Javascript and CSS — the principal components of the web — are notorious for just doing nothing when you get the syntax wrong. Chrome offers some assistance in this arena as well; if a CSS property name is unrecognized, it appears crossed out, just as if it were overridden by a higher-priority declaration higher up, but there's also a warning triangle next to it, shown in figure 15. However, Chrome only helps out when you make a mistake in a property; there are (unfortunately) no tools to highlight malformed selectors or warn you when a selector didn't match anything in the document (which may or may not be an error).
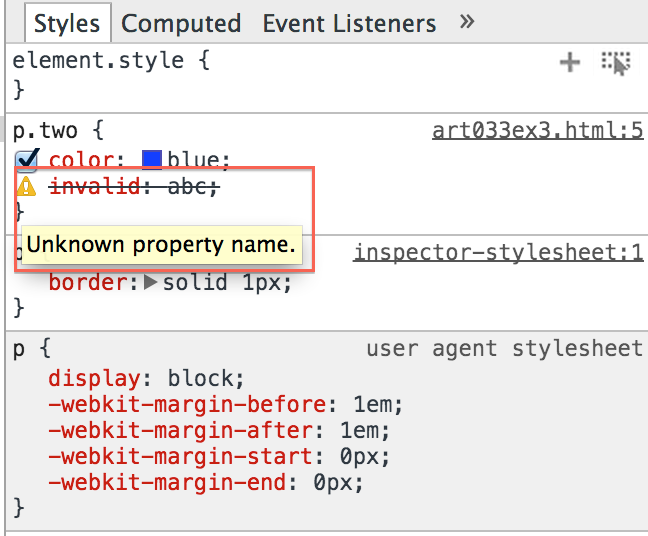
Figure 15: invalid property
You probably make quite a bit of use of "shorthand" properties like
border, margin, background, font,
etc. When you do, Chrome faithfully reproduces exactly what was specified in
the origin stylesheet; however, there's a disclosure triangle next to the
property that you can expand to see everything that it's a shorthand for as
shown in figure 16.
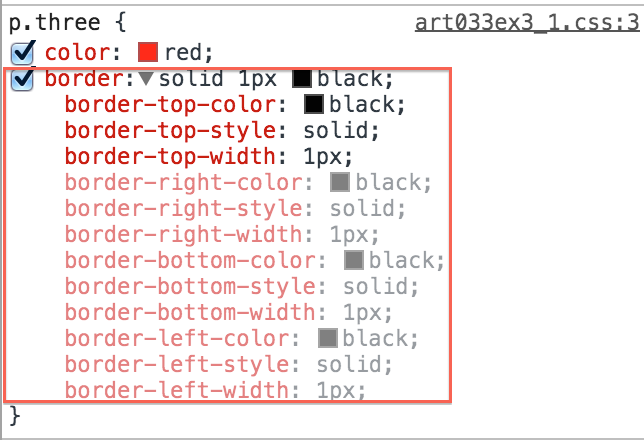
Figure 16: shorthand property expansion
As you can see, the properties that were set by the stylesheet are shown in a darker red than those that were defaulted.
Figure 16 illustrates a point about Chrome's internals, too — notice that
border-top-color, border-top-style and
border-top-width are highlighted as specified while right,
bottom and left are dimmer. This implies that
Chrome treats a shorthand property by setting the "top" property and letting
the default CSS behavior of propagating top to right, left and bottom if
unspecified take care of setting a common border around the entire element.
If you omit any of the "core" properties, the disclosure area just reports "initial" as shown in figure 17.
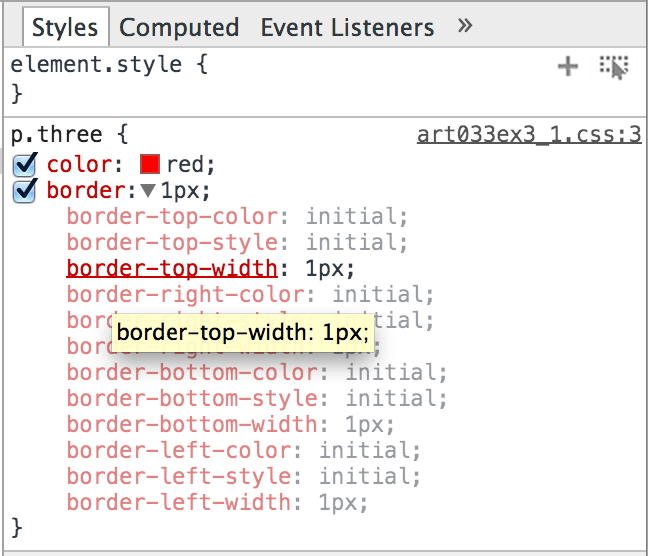
Figure 17: initial properties
Also, if you're doing proper responsive web design, you rarely (if ever)
specify the unit px for anything (ok, ok, but that's the idea
anyway). You can see what these actually work out to at various sizes and
resolutions by going to the computed subtab. In figure 18,
I've specified:
The computed values show me what these actually work out to in pixels at my
current browser width.
p.three	{
	margin: 20%;
	padding: 1em;
	height: 1in;
}
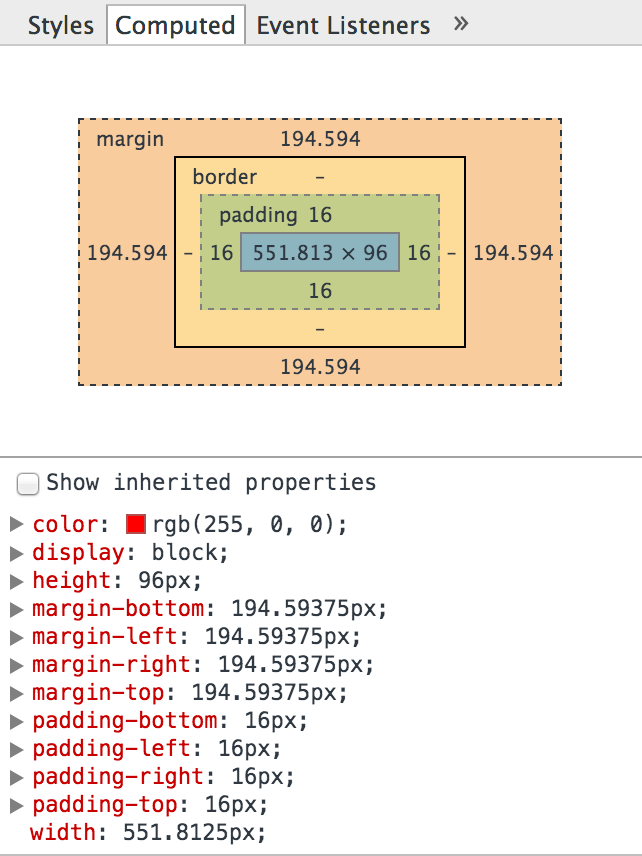
Figure 18: computed numeric values
An easy-to-overlook, but useful helper when dealing with long stylesheets, is the "Find in Styles" search box shown in figure 19. This searches specifically in the styles that apply to the selected element; if you have a lot of stylesheets with a lot of selectors that might match a single element, this can be very handy; don't forget that it's there.
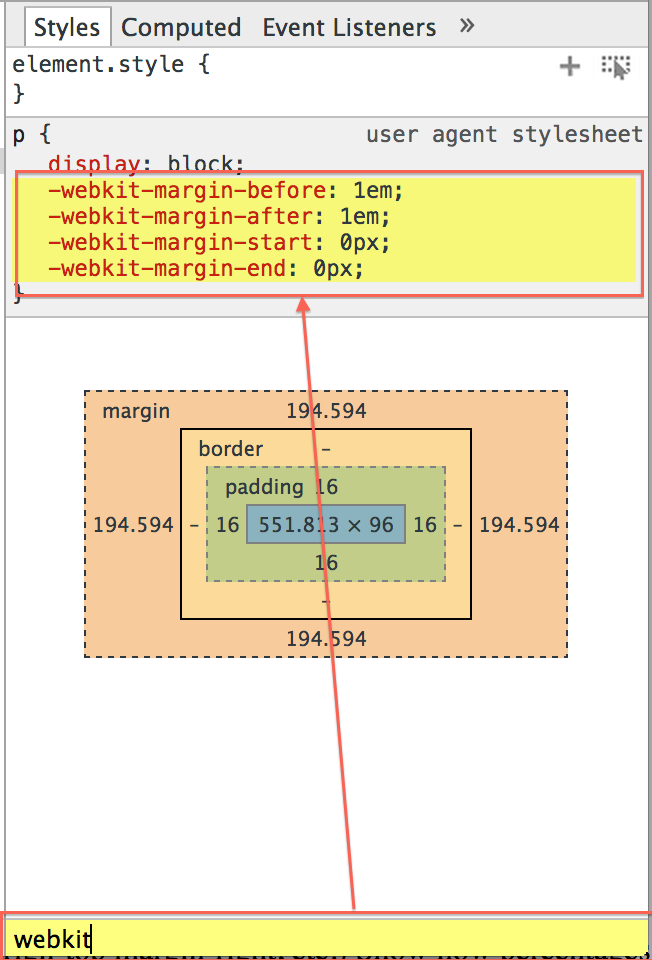
Figure 19: Find in Styles
The last thing I want to illustrate is how Chrome represents the cascade itself;
remember that the "C" in CSS stands for "Cascade". That is, each element
inherits the styles of all of its parent elements unless otherwise specified.
This "specification otherwise" can happen in two ways; implicitly, if a CSS
property is listed as non-inherited by the CSS specification itself, or
explicitly, if a CSS rule of higher precedence overrides it (illustrated above,
in figure 5). Example 4 shows a paragraph wrapped
up within three <div>'s, each with a specific declarations.
<html>
<head>
<style>
div#one {
	border: 1px solid black;
}
div#two {
	background-color: blue;
	text-indent: 1em;
}
div#three {
	color: yellow;
}
p {
	font: 12px bold times sans-serif;
}
</style>
</head>
<body>
<div id="one">
  <div id="two">
    <div id="three">
      <p>This is wrapped within three divs</p>
    </div>
  </div>
</div>
</body>
</html>
Example 4: Cascading elements
If you open up the debugger tools and select the <p> tag,
you see the display in figure 20.
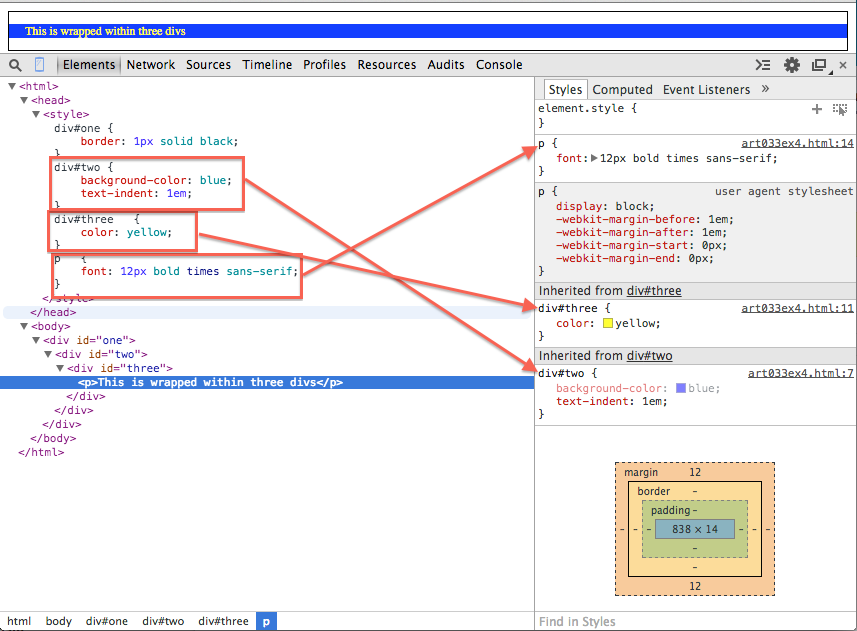
Figure 20: Inherited/cascading styles
Chrome shows that the style is "inherited from" the given element, and the
element is a hyperlink that can take you directly to its definition in the
HTML source. Notice that the <p> tag inherits from two
of its parents, but not the topmost one. Why? Because border
is a non-inherited CSS property. Since <div#one>
doesn't contribute to the display of the selected element, it doesn't appear.
However, notice that background-color, which is also
a non-inherited property, does appear in the styles display — the entire
display is shown if any of the inherited properties apply (as is the case
with text-indent), but the non-inherited ones are shown faded.
This can occasionally create a bit of confusion, because defaulted short-hand
properties; figure 21 illustrates the defaulted short-hand properties of the
font property along with the non-inherited properties. Just be
aware of the context that you're looking at when examining elements.
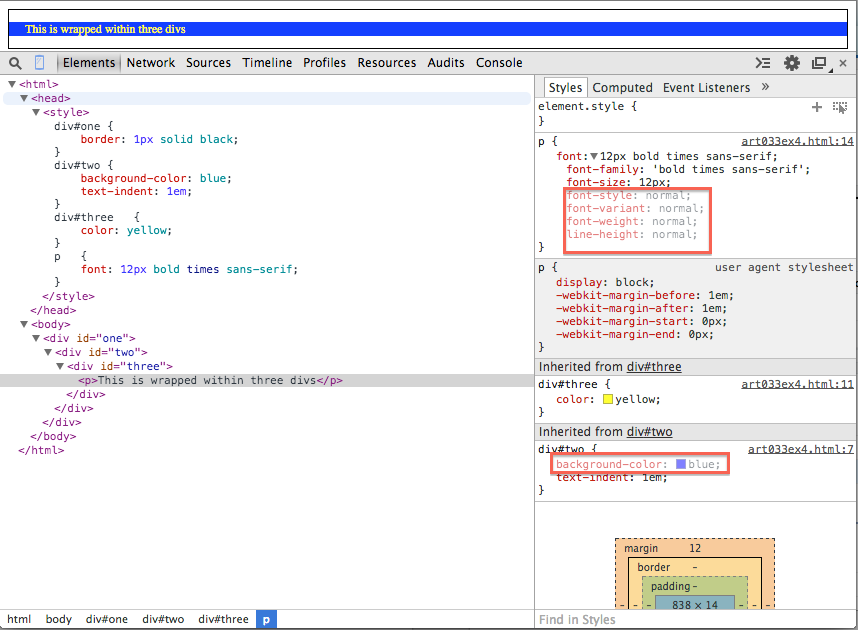
Figure 21: shorthand properties and non-inherited properties
That's all for now. Next time, I'll take a look at the Network
tab that shows you what was downloaded, when, and from where, and can be
a huge help in speeding up your page loads.